|
Statistics
Total online: 1 Guests: 1 Users: 0
|
Trade
Description Bollinger Bands for Forex
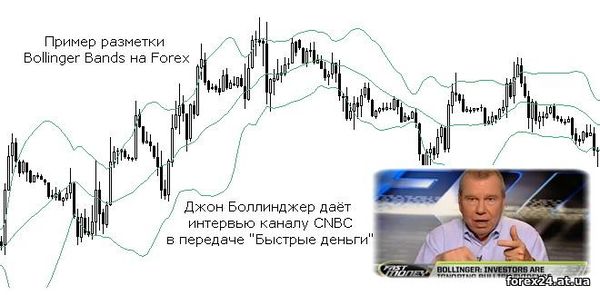
The Bollinger Bands indicator, or as it is also called "envelope", "line", "channel" Bollinger is a very simple but very efficient tool to quickly assess the prevailing market forces.
For the first time traders learned about it from the author – John Bollinger, expounded in his articles its own vision of with a standard deviation of current price from the average prices for the period.
It is noteworthy that Bollinger is not a simple teacher, he currently runs his own company, Bollinger capital Management (from the English. Bollinger Capital Management), which specializiruetsya on attracting investment and capital management, as well as sometimes appears on CNBC as an analyst.
Calculating and setting Bollinger Bands
On the chart, the Bollinger band is represented by three lines, the Central of which represents nothing, as a moving average over a selected period of time. The other two are graphical representation of the result of amendments calculated average rates on the values of standard deviations.
To build the Central line Bollinger Bands in MetaTrader speculator chooses the calculation period. If necessary, you can even put the number of bars on which the marking will be shifted relative to the X-axis (time axis) to the right or left.
In the standard version of the indicator you cannot change the moving average type (SMA automatically calculated), but today in the network there are modifications in which the user can choose the formula for calculating average prices. In fairness, we note that any positive effect of such manipulations do not bring – tested.
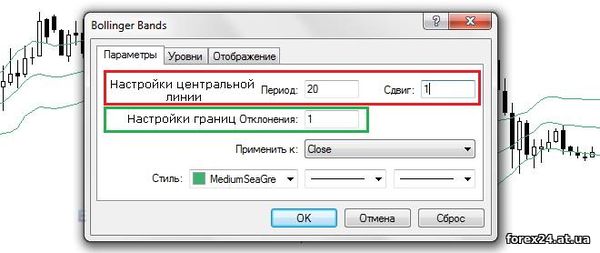
To customize the borders of the envelope provided for moving the "deviation", here the trader specifies the number of standard deviations that the Bollinger Bands will add to the value of the Central line to build the top border, and will deduct from the "center" for the calculation of the lower bound.
The user can also specify the type of price the indicator will base its calculations. Speaking of prices, if you configure this option, be aware of some features:
• If you select Close, you will have to wait for the current candle to close to confirm the signal.
• Typical price is one of the most objective options as it considers the maximum, minimum and last price of the candle, but it also requires confirmation.
• Price Open fixes the problem with redrawing on the last candle, so it is scalpers.
In the following figure as an example, presents two Bollinger Bands with the same periods, but the red is designed for a single standard deviation, and the blue on the triple:
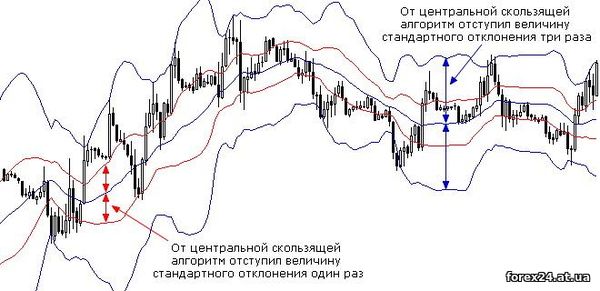
Differences visible to the naked eye, it is obvious that the wider range of fluctuations in the trading instrument, the greater should be the indentation, expressed in number of standard deviations.
Strategy for Bollinger from the author
John in articles and books examined in detail the optimal trading scenarios for his "brainchild." It turns out that we already have the ability to simply follow the advice of the author and the results of many years observations of other traders without spending time learning all the nuances of the algorithm.
Pay attention to these indicators:
• Standard Deviation
• Laguerre
So, recently singled out as the main signals Bollinger Bands following typical situation:
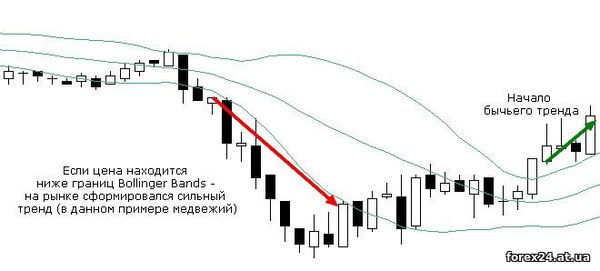
If the price breaks the border of the channel and is from the outside, it is possible to speak about formation of a strong trend:
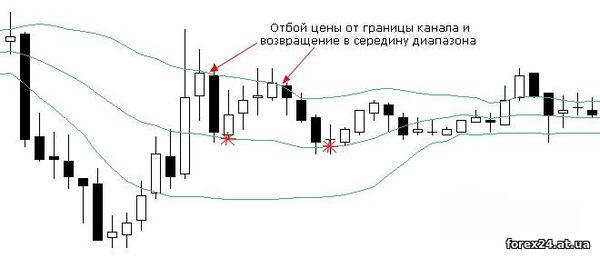
If the price bounced off one of the Bollinger bands, it is likely to reach mid-channel. This feature is connected with the desire of the market (which is regarded as the collective wisdom of many speculators and investors) to return to the equilibrium condition:
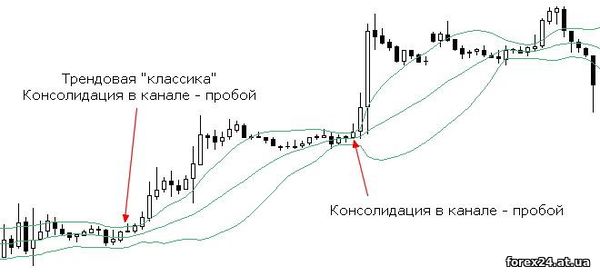
The most powerful movements start after the price for some time been in a narrow range. This pattern is easily explained, since all the pulses starts after the consolidation (trading):
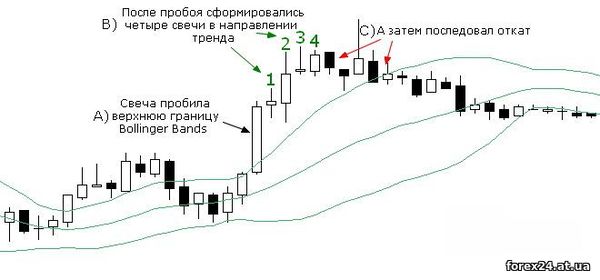
After the price broke the Bollinger Bands and trend began (see paragraph 1), the movement rarely lasts more than four candles in a row. After remission of the shock wave is formed is often rolled back, and some people even build their intraday strategy (M15 and M30) to account for this pattern:
And the last point is rather theoretical – it has been observed that about 90% of the time trading the market is within Bollinger bands. Typically, these patterns are used in the third strategy (breakout range). Some programmers who create expert advisors that use Bollinger Bands in the most unusual combinations with other indicators (sometimes it acts as a filter, sometimes as a criterion for placement of stops all depends on the creativity of the author).
As you can see, the Bollinger bands is a versatile algorithm capable of generating signals to buy/sell and recognize emerging trends.
As for the cons of the Bollinger Bands, it is not our own experiments or research other traders have not found serious shortcomings in the indicator. The only thing you should pay attention is to the selected trading instrument was liquid because of the low liquidity even a single large player can move the market hundreds of items in small volumes. In such a situation, of course, the standard deviation (at the Foundation of the Bollinger bands) is meaningless.
|
| Category: Binary options | Added by: (07.11.2017)
|
| Views: 498
| Rating: 0.0/0 |
|
