|
Statistics
Total online: 1 Guests: 1 Users: 0
|
Trade
Description market facilitation index. Forex indicator MFI.
For the first time Market Facilitation Index were described by bill Williams in his book "Trading chaos". This paper presents the theory of the combination of volume and price movements to fully have an understanding of current market conditions and make the most correct decisions.
MFI (market facilitation index), captures the price fluctuations of each tick by displaying a histogram of different colors. This indicator is calculated by special formula:
BW MFI = (High-Low)/Volume. Two large letters in the indicator name is the initials of bill Williams.
At its core, it allows to objectively evaluate the performance of the market, to find a confirmation of strength or weakness. What is the performance? Productive market, first and foremost, characterized by a high level of liquidity, where most market participants involved in trade, making regular purchases and sales of a certain asset.
With the active action on the part of participants, the market will be the most effective, but if their total number will decrease or they will not feel interest to further action, it will decrease overall performance.
Interpretation of the indicator Market Facilitation Index
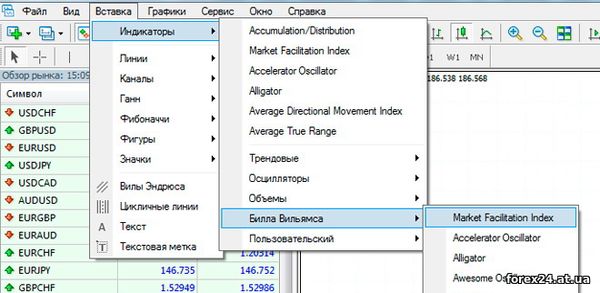
This technical analysis tool can be used on any asset and time intervals. It gives fairly accurate signals in all time frames starting with five minutes and ending month. Most often, this tool comes preinstalled on all modern platforms, for example, in Metatrader 4 it can be found in the section of development bill Williams.
On a chart this indicator is presented in the histogram of different sizes and colors.
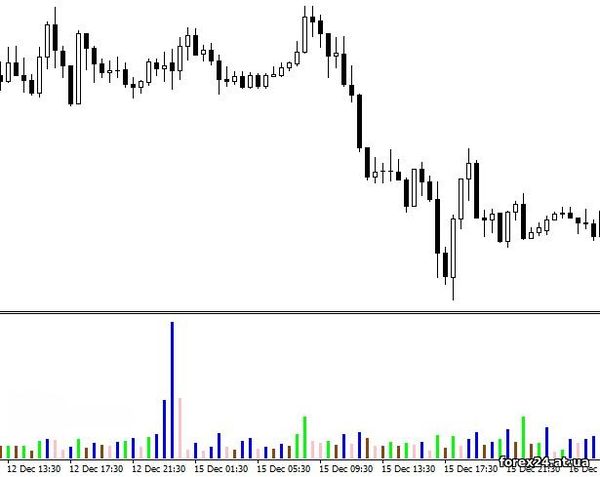
The working principle of Market Facilitation Index is pretty simple. Considering the testimony of the indicator, we do not consider the absolute figures, that is, the size of the histogram bars, we are not so important. All we need is to track the dynamics of price changes and correlate with the readings of the indicator. For simplified visualization of the columns of the histogram have different colors, and in the settings tool, You can set the color.
Trading signals Market Facilitation Index
The author identified four conceptual patterns that reflect the interaction of the MFI and market size, which are expressed in different colors ( 4 colors):
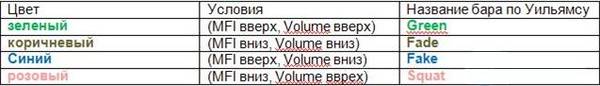
The green histogram means that the market is growing trend. The best option for investors is to look for potential entry points only in the direction of the dominant trend to maximize their profits. Positions against the trend can bring significant losses, and accordingly, such transactions should be avoided. The appearance of the green bar of the histogram shows us three important points:
• the market appeared a large number of participants;
• the majority of participants opens positions in the direction of the dominant trend;
• current market trend is gaining momentum.
The blue histogram indicates the movement, which is due to indeterminate causes not supported by volume. This means the fact that at the moment in the market is backed by a limited group of investors trying to manipulate the market to their advantage, but the majority of participants not interested in further price movement.
Pink color histograms is most likely to occur at the end of a prolonged trend. In this case, the volume begins to grow steadily with the arrival of new market participants, but the price is not trying to start a "rally". Instead, she konsolidiruyutsya in a narrow range and the market enters a phase of accumulation (accumulation). In this case we get two possible outcomes: the price after a short break, continue to move in the same direction will be full-fledged trend reversal.
The practical application of MFI
Market facilitation index Forex is used by a large number of investors and is a member of various trading systems, as a major source of signal for entering a position or an additional filter. Let us consider a few examples of the use of this indicator.
Still recommend to pay attention to these two indicators:
• TDI
• Rubicon
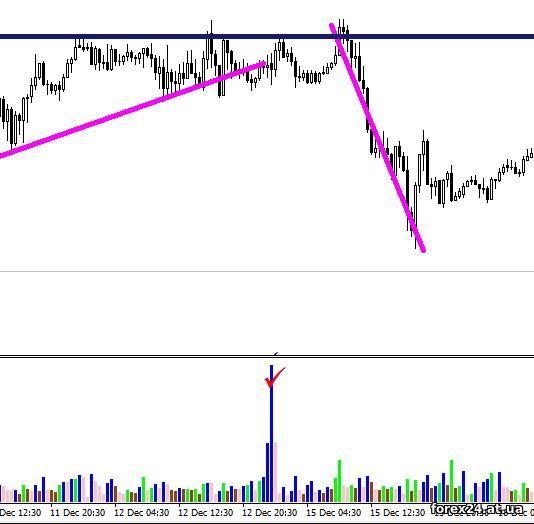
In the figure, we observe the following pattern. First, we see a clear upward movement, but in the future there is the appearance of the histogram of the blue color near important price level. As a result, the price begins a rapid decline, why did it happen?
This is due to the fact that price approached the level of buyers and has stopped active trading, considering that investing in a trend continuation is unprofitable. Level has been activated order sellers, and the proposal was stronger than the demand so the price went in the opposite direction.
About support and resistance was not said by chance, we have to consider the indicator near important price levels. Thus, we can create the most objective picture of the market and find the most likely entry point!
Of course, this indicator of technical analysis deserves attention due to its simplicity and accuracy. It is often used as a complement to the trading system, filtering out "weak" point of entry. Despite its simplicity, beginners need some time to observe the MFI to really understand his philosophy and principle.
It is not necessary to open a trading position based solely on the testimony of this tool. You should evaluate the context of the market and find the most probable entry point, and for this it is possible to combine several indicators and have a clear action algorithm.
|
| Category: Binary options | Added by: (07.11.2017)
|
| Views: 432
| Rating: 0.0/0 |
|
