|
Statistics
Total online: 1 Guests: 1 Users: 0
|
Trade
Heiken Ashi indicator - description and method of application on the Forex
In the financial markets successful development is always very quickly "acquire" the modifications that happened with the Japanese candles, for example. Enthusiasts from different countries have started to develop a set of indicators based on the same idea as the candle.
In 2004, there was a mention of a tool called Heiken Ashi which now has a standard set of popular on the Forex MetaTrader 4 platform. View, what is the Heiken Ashi indicator.
When you install the test chart I recommend just to change the color in that picture was the most vivid and quick read. Settings the algorithm is low,you could even say that they are not, so there is nothing to tweak for each specific asset is not necessary. Looks on the chart Hijken ASHI as follows:
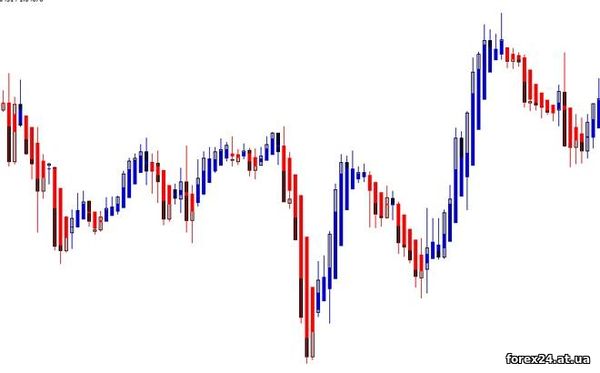
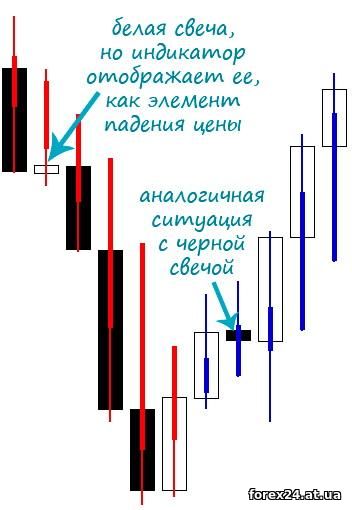
In the illustration above, if you look carefully, with the diversity indicator visible normal Japanese candlesticks. You may notice that there is a difference, and besides, Hijken "smears" colors, underlining the most significant price movements. For example, if there will be a series of 5 candles, four of which are white (growth), and one in the middle is black (drop), the flow chart we'll see, probably just a row of blue (color chosen by me) bands:
Once it becomes clear that the algorithm works primarily to identify and demonstrate market trends, he will not peddle it, providing information about every jump in price. You can make a preliminary conclusion that the Heiken Ashi indicator will be useful in trend trading.
Especially the use of Heiken Ashi indicator
As mentioned above, the indicator is resistant to short-lived market fluctuations, as if ignoring them altogether. On the one hand, we can talk about information loss, but if we're going to work with the trend, no problems there. In the end, Hijken ASHI no algorithm for scalpers.
Search with Heiken Ashi entry point into the market, in my opinion, not worth it. If you try to do in any market situation when there is no trend, we will get loss on the transaction. This algorithm shows a good market trend, allows to reveal the General dynamics on the chart, eliminating "noise" but for transactions it is better to use additional indicator:
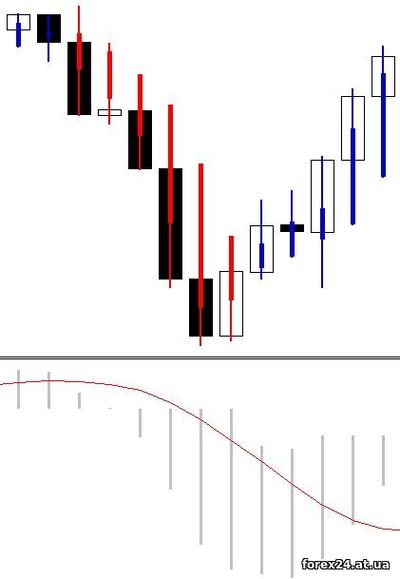
The figure above illustrates the market situation mounted chart indicators Heiken Ashi and MACD. The first algorithm acts as a filter, it helps to understand what the current situation on the market. MACD while seeking points of entry into the market, but they should not be directed against the trend of Heiken Ashi, otherwise the oscillator signals must be ignored.
In other words, to make a deal, we need to look at the MACD and wait for the bars of the oscillator will break the sequence. For example, the next bar was above the previous, but closes another candle and the MACD value is lower than in the previous one:
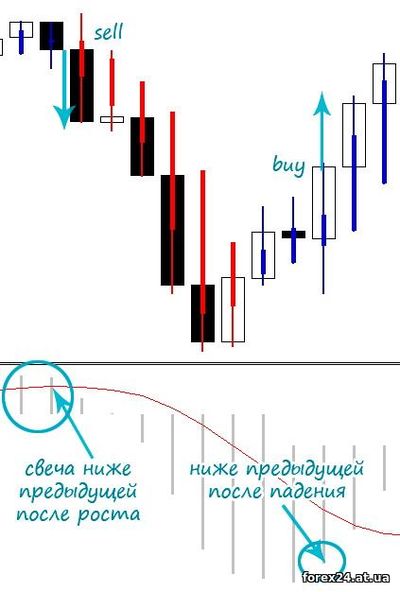
Such a situation may be considered as a signal to enter into a transaction to sell, but first need to see what Heiken Ashi is showing us. If it is red, everything is normal, open position, and if the color is blue, then the transaction should be avoided.
Thus, positions are opened only in the direction of Hijken ASHI. By the way, the MACD was taken just for example, but can also be used in the work of any other algorithm that is looking for good entry points, perhaps even not of the group of oscillators. You can pay attention to one of these indicators:
• Scalper Dream
• IVAR
Patterns for Heiken Ashi
Traders gradually began to notice some patterns in the data indicator Hijken ASHI and development of the market situation. Over time, there are patterns that are used with this algorithm. You can probably find a lot of diverse versions, but will present the most popular and reliable patterns:
• Long candle almost without shadows is probably currently on the market a strong trend, which can be a consequence of the release of important economic news.
• Candles with shadows that have length inferior to the body size of the candle (when the market moves up or down, not sideways) - the "normal" trend, a gradual retreat in prices one of the parties.
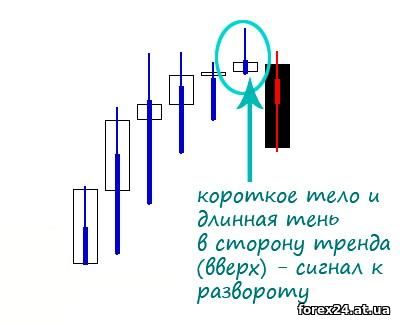
• Short candle body and long shadows or flat, or a reversal candle (doji sample), which depends on the context. If the market experienced a flat, the market just fluctuates in a certain price range, and if we see a candle in the trend movement, you can perceive her appearance as a signal to turn.
• Short candle body and long shadows, pointing in the direction of the trend reversal of the market. For example, the market falls and at some point closed candle with a short body and long lower shadow, then we can talk about the high probability of a price reversal up.
The main provisions formed the basis for data patterns that experienced traders are already well known on the candlestick theory. In principle, no reason after all to invent something completely new when candlestick patterns can be projected on the situation with Heiken Ashi indicator.
The algorithm Hijken ASHI simple, if you pay attention to the formulas that are its Foundation. I see no sense now to lead and to comment on these formulas, but I can say that nothing supernatural is not there, everything is logical and simple enough. The indicator is well suited to eliminate market noise on the chart and identify the medium-and long-term trends. For effective trading it is advisable to combine with other indicators.
|
| Category: Binary options | Added by: (07.11.2017)
|
| Views: 722
| Rating: 0.0/0 |
|
