|
Statistics
Total online: 1 Guests: 1 Users: 0
|
Trade
IVAR Forex indicator index variations
Fractal structure in financial time series are representatives of fractal time functions. They were taken as the basis of the IVAR indicator that calculates the variation index.
Apparently, for traders who are not familiar with the theories of Mandelbrot, and didn't really want to delve into the details of the fractal time functions, just to understand what the strengths and weaknesses of the indicator.
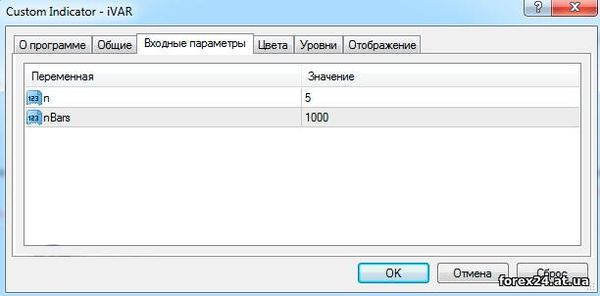
In this case, the authors even thought of such a thing, as the variation index (m), which is used in the indicator. In the program window You can see the level of 0.5, which is the default value for m.
IVAR is configured very easy, because it has only two variables:
• n is a power of two (the variation index calculated in the interval 2^n);
• nBars - number of bars of the current timeframe.
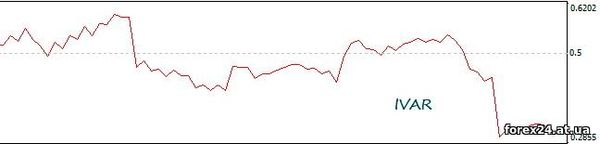
The IVAR indicator is a separate window that changes its value line, which is around 0.5. The program is not bulky, comfortable and quite informative. Let's look at what we are shown by this algorithm.
Indicator IVAR
The indicator line can move within the selected area (window), taking values above or below m. It is believed that the decrease in the line below the mark of 0.5 indicates an increase in the strength of the trend. If the indicator rises above the level of the market activity, is included in the flat state.
The program does not give us the opportunity to understand which side is moving trend, but it can be obtained using other indicators, such as Rubicon. Turns out, it is possible to create a system that objectively would be not only to identify the direction of market development, but also to help determine the strength of the emerging market movements.
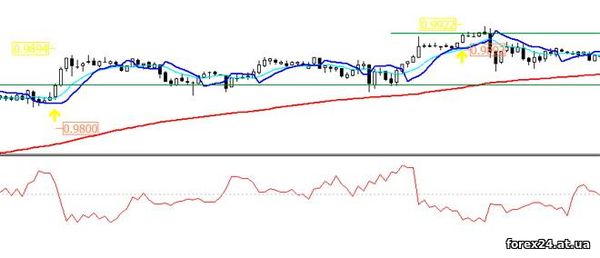
Fluctuations in the IVAR line near the 0.5 level give us to understand that the market is currently in the flat condition (still say that the market goes in the direction). So it is possible to obtain information on what the state of the market and make an informed decision to enter into agreements or wait for the change of circumstances.
The variation index may have brought to the work indicator some of the features, but to be honest, there are other options that cope with the similar task as well, e.g. Standard deviation. In both cases, should be combined with other elements of the trading system. Now refer to the extreme values of the indicator:
• if the line is at the upper limit of the indicator window, it is a demonstration of the calm state of the market (high probability of a strong market movement);
• if the line is at the lower edge, it is a demonstration of a strong and continuous trend (high probability of imminent correction).
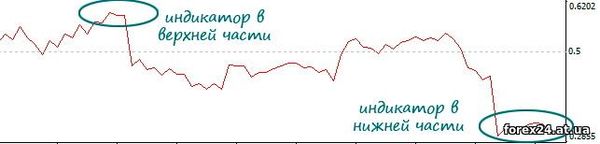
Fluctuations around the line of 0.5 means that the market has been in a state of uncertainty (in these times it is better not to sell in the market). As You may have guessed, very convenient to catch the market reversal when the line is IVAR gets to the bottom of your informational Windows. This is a good opportunity to prepare for changing market trends.
|
| Category: Binary options | Added by: (07.11.2017)
|
| Views: 463
| Rating: 0.0/0 |
|
