|
Statistics
Total online: 1 Guests: 1 Users: 0
|
Trade
Standard Deviation - full description Forex indicator
The indicator Standard Deviation is a standard set for any modern terminal and is used in many profitable trading strategies. In English the name of this algorithm means "standard deviation", therefore it is not difficult to guess that it was borrowed from the statistics.
In the General case the Standard Deviation shows the deviation from its average value. In the real sector similar patterns applied in virtually all areas, ranging from theoretical mathematical examples and ending with the analysis of the results of important experiments and observations.
In financial markets the standard deviation shows the deviation of current price from the average prices over the selected period (in other words, the STDEV shows the deviation from the moving average). The formula of the indicator are borrowed entirely from the statistics, therefore, requires no further comment:
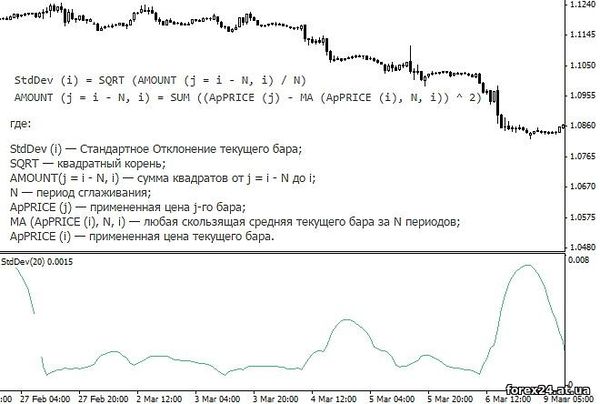
In the indicator settings the user can set the type of moving average (moving "method MA") and prices, which will include the algorithm in their calculations (the field "apply to").
How to apply Standard Deviation to search for trends
In MetaTrader standard deviation relates to the class of trend indicators, as using this tool to evaluate trends in the market. It is worth considering that the interpretation of its values will be slightly different from other indicators for the same group.
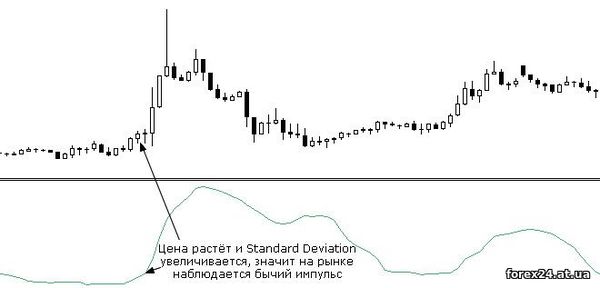
As noted above, the Standard Deviation shows the spread of prices from average, and what is a trend in Forex? In the vast majority of cases – this is a powerful impetus up or down, resulting in a significant price deviation point from the average.
Therefore, if the price starts to rise znachennya Standard Deviation increases, it's safe to talk about the beginning of a new bullish momentum:
In principle, it is logical and understandable, since the pulse can be seen without additional tools, but the main purpose of the standard deviation is reduced to one operation - time zoom trader on the completion of the movement (which would indicate a decrease in the value of rejecting):
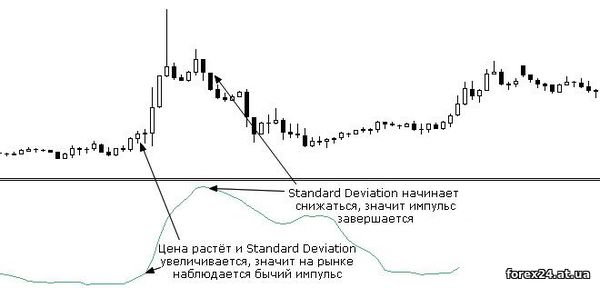
In this case it's simple – if prices begin to strive for the moving average, then the market began or consolidation, or reversal. Both options pose additional risks, so it is better to close a long position and wait until the market will be a new impetus.
Bearish trends are defined in a similar way, the main thing to remember is standard deviation always grows on the impulses, no matter he is bullish or bearish, in this case the formula takes into account the value of the modulo.
Standard Deviation and trade on pullbacks
In fact, search trends, through deviations is a non-standard way of working with disabilities, you can even say "most unreliable". More often the indicator Standard Deviation is used to find entry points into the direction of the identified trend.
To focus on the methods of identification of trends today will not, because each trader has their own observations, so the following examples will use a simple moving average.
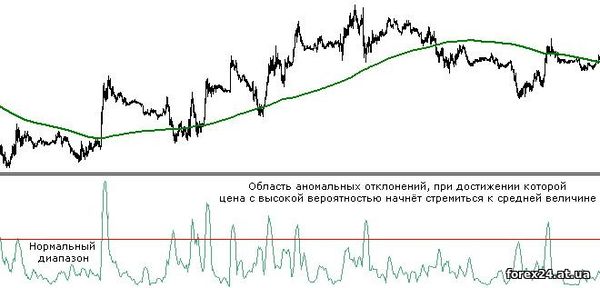
Such strategies are based on simple assumption – if the price is significantly deviated from its average value, then with high probability we can expect the development market contractrate. The crowd sees that the asset has become much cheaper (or more expensive) of its fair value and begins to buy (sell).
Now a few words about the notion of "significant deviation. As already guessed by many readers, each deviation can be considered a signal, since small fluctuations in the market are valid. The market needs some freedom in order to without artificial injections by major market operators be able to safely reduce the flow of requests for purchase and sale, without creating a significant "bias".
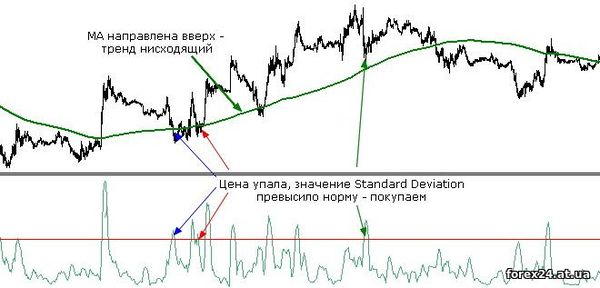
That is why attention should be taken really serious deviations from average prices, the value of which is estimated at history and reflected in the graph Standard Deviation horizontal line:
The strategy of the pullback trading involves buying and selling the asset after the achievement of the STDEV of its extreme values. Brief rules can be formulated in the following way:
• If the trend is upward and Standard Deviation crossed the border of the normal corridor by reducing the price of (correction within a bullish trend) to buy the asset;
• If the downward trend and the indicator went beyond the normal range when the value (a correction within a bearish trend) – sell the asset.
Pay more attention to these indicators:
• CCI
• X-Lines
Some traders use even more tools in order to identify the very correction, but it's unnecessary. In fact, nothing complicated in a visual assessment of the market there, because if the price drops after continuous growth is a correction, and there is no need to create complexity.
Special attention deserves the issue of selection of optimal parameters for Standard Deviation. Experience shows that the best results of this trade brings in the timeframes to "zasavica" inclusive, provided that the company calculate the STDEV does not exceed 24.
|
| Category: Binary options | Added by: (07.11.2017)
|
| Views: 579
| Rating: 0.0/0 |
|
