|
Statistics
Total online: 1 Guests: 1 Users: 0
|
Trade
Tick charts binary options
What is a tick chart and what are its features? First recall the most common in the financial markets price chart. It represents the dependence of the price from the time when the X-axis is time and Y-axis market price.
Depending on the scale each bar on the chart will correspond to a certain time. In every bar "fit" all the values in market prices, which appeared during its formation.
To give an example, suddenly You with the price schedules have not yet met. By the way, if only to get acquainted with the binary market here is a free introductory course. For example, each bar is formed 5 minutes, then all prices by the market during this time will be reflected in this bar, as on the chart:
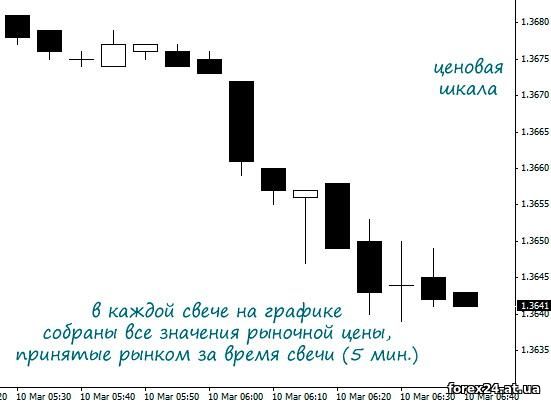
So, we can see the range of prices received market every 5 minutes, but will not be able to know exactly how many times was adopted the specific price. This is one of the differences between the price tick charts and binary options, however, in other markets too.
The tick chart binary options is the sequence of all market prices without reference to time. It turns out that before us is only the vertical scale (Y) to the right of the quotes. All changes in market prices appear to the left of the vertical axis, each new value to the right of the previous one.
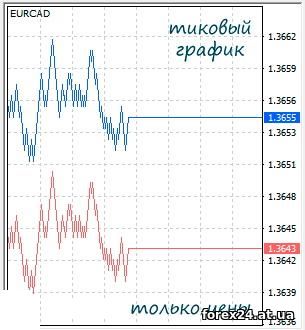
In this case, no matter how many times the price changed within 5 minutes or any other period. We see only the sequence of prices, without being distracted by time intervals.
What's the advantage of tick charts? We see only the market price observed, in what direction it is changing, not taking into account time. Sometimes the market changes its value, say, 30 times per minute, and may be such that the price will change 5 times and all. If we had a tick binary options, we would see only change values, not knowing for what time all this happened.
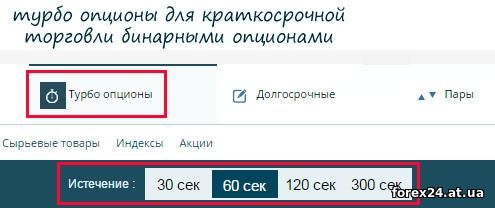
Very convenient, this method of information display for those who prefer to trade short-term deals. If we talk about the binary options market, then we, of course, about the turbo options. In fact, the market only gives us information about the new current prices, that's all. Charts showing change over time, this is a kind of derivative form of the data that are on the market.
Mention should be made of the lack of tick charts, which is a relatively small data file, stored by the broker. Is possible to scroll the history back to see where yesterday the price formed, for example, the level of support. All the ticks are more used to trade on a situation that would assess the latest changes in the market prices, to see the trend and take trading decision.
Any special strategy for the tick binary options me to never seen, at least, quality. Still binary market is very much tied to time, as at the close of a position is always defined in advance, so the ticks are more popular Forex or stock market. But there is a qualitative strategy for short-term options, for example, like this:
Scalping turbo options - recommend a good technique.
You could try to find regularities in the change of the market price, but it is not known exactly how much time will it take for the emergence of a new tick, which we will need. It's a shame, if the price will change exactly as we expected, but after the time of execution of a binary option.
Unfortunately, tick charts binary options there are difficulties, as the display market information was not popular among the brokerage companies, providing a shopping space for customers. The reason apparently lies in the strong dependence of the trader on the binary market from time to time. The illustrations given above relate to the terminal market.
|
| Category: Binary options | Added by: (07.11.2017)
|
| Views: 396
| Rating: 0.0/0 |
|
