|
Statistics
Total online: 1 Guests: 1 Users: 0
|
Trade
Lines of support and resistance - the whole truth without embellishments
Perhaps the subject lines of support and resistance is one of the most "hackneyed" in the network. Pass it by I would not like, but tell about the incredible benefits of these levels is also not beneficial and there are reasons for this, which will explain below.
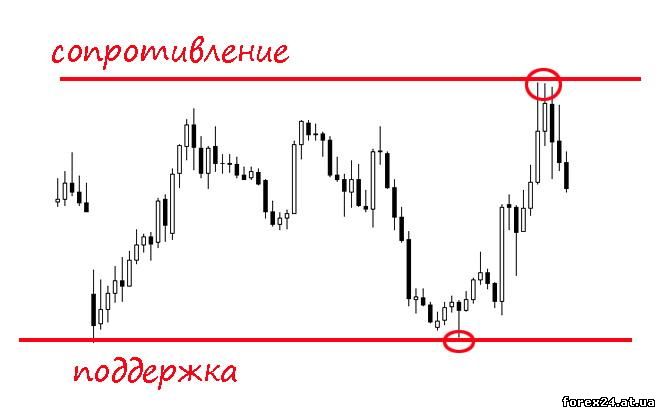
For a start I suggest to see what the support line and resistance line on Forex. Since no Forex technical analysis without these lines (levels) do not think, we will start with dry definitions.
• Support line (support) is the price level, which is formed in the region of local minimum (extremum).
• The resistance line (resistance) - price level, which is formed in the region of a local maximum on a chart (extremum).
The words "level" and "line" in this case interchangeable. What are the indicators on the chart, shown below.
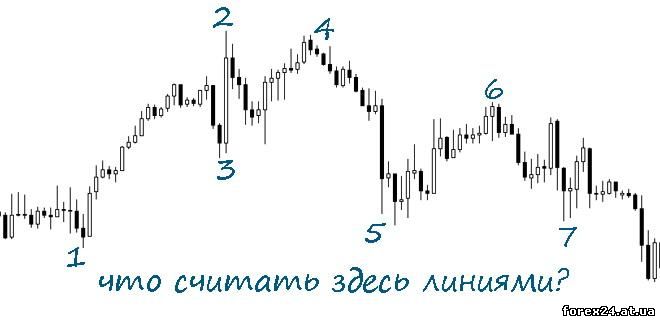
Below is the illustration, which clearly shows that the market is moving from point 1 down. This means that applications sellers dominated the market, covering all the volumes of buyers. At point 2 the situation has changed, after all, willing to buy at the current price of the tool (currency) has become more than people who wish to sell their volumes.
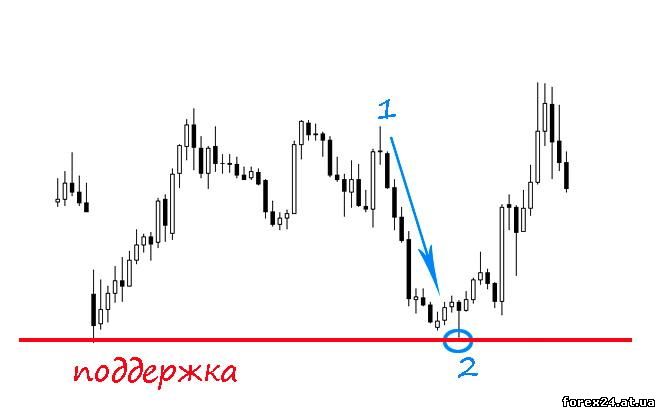
In point 2 starts the growth of the market, and after the local minimum is the horizontal line, and which will be called support. This level supports the price. Have in mind that on line 2 there is a considerable volume of buyers who are unable to receive the goods (currency pair) for the price you were hoping for.
Of course, over time the volume of buyers in this area to resolve, but in the near future the likelihood of the breakout of this price and waste of the market down will be lower than the probability of growth. Hence the meaning of the name - volume buyers support the price without letting it go down below.
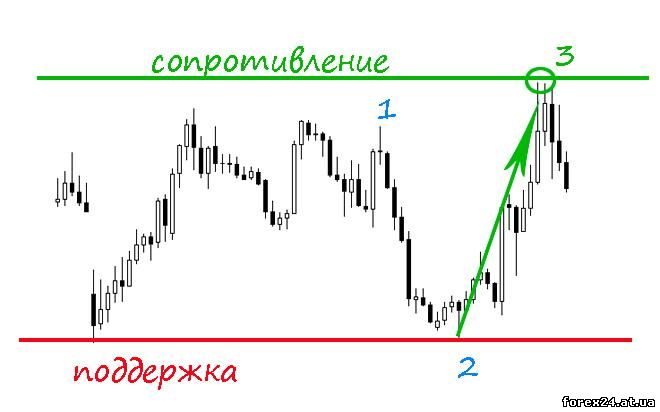
Similar situation with the local peaks that are formed as a result of changes in market trends. As you can see in the image below, the buyers drove the price up, being ready to acquire the volume sellers for greater and greater price value. In the end, when the market reached point 3, the purchasing power has decreased, and the desire to sell such a high price for this tool is rather increased. They formed the resistance level.
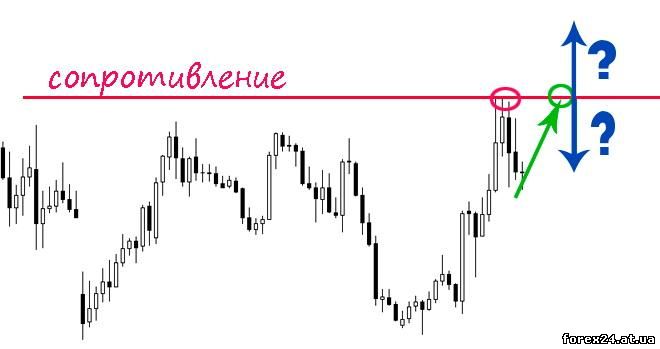
Please note that on the chart gradually formed new support levels and resistance levels which have to be considered in their trade.
Features of work with lines of support and resistance
The difficulties begin even in the process of demarcation of the schedule, and in the moment when you need to understand what the market price will do to the next level when you approach. This is the problem that many articles are trying to avoid. The price impact from the line, for example, resistance, it will break it and go higher.
The task of the trader will boil down to the fact that would pick up filters in their trade, are able to leave a situation with a particular development that we need. For example, if you talk about trade in the Asian session, when most of the market growing, flat price movement, it is more likely a bounce. You can pick up at the market time periods or circumstances when the opposite is more likely to be a resistance level.
Introducing such rules in their trade, a trader will no longer wonder what to do when the price is suitable, for example, to the level of support, to open a transaction on the rebound (from the lines), or sell, hoping that the market will be strong and will penetrate conventional line.
In various trading systems price levels support and resistance are used in different ways, but the principle of identifying them, usually one and the same. Most often, currency speculators prefer to visually determine the location of certain levels, which leads to a high level of subjectivity in this process.
Difficulties in defining the relevant lines
As mentioned above, when the lines of support and resistance, traders can look at the situation. As assessment is performed visually and without strict rules, the ruling levels can vary considerably in several specialists.
A more sophisticated technique of calculation of price levels usually used by experienced traders. In this case, the location of lines are not determined on the eye, and are calculated mathematically. It is an objective, but much more rarely there are ways to determine levels on the chart.
Whatever it was, and support and resistance characterize the market price ranges, in which there is a change in the leading roles. If we talk about resistance, it is formed where the sellers is greater than buyers. If we consider the resistance, this region began the dominance of buyers over sellers.
These lines are some of the basic tools of technical analysis, and so, for new traders will be a must-understanding of the principles of their construction and the meaning, which are equal. Their use, as has been said, depends on the context, that is, from specific trading system.
|
| Category: Forex | Added by: (05.11.2017)
|
| Views: 407
| Rating: 0.0/0 |
|
