|
Statistics
Total online: 1 Guests: 1 Users: 0
|
Trade
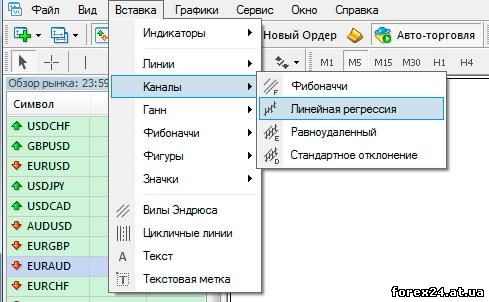
The indicator for the construction of a linear regression channel
In a standard set of trading terminal MetaTrader 4, you can find quite a few useful tools of technical analysis. Among them are linear regression channel that allows for a few seconds in automatic mode to plot three parallel straight lines representing the channel in the selected time period.
From the trader you only need to specify on the chart, the temporary section of the market will be the indicator for the construction of the linear regression channel.
Why the need for this tool? Of course, you can choose an ordinary straight lines and use them to build a price channel but is it possible to call this method the objective is the big question. In addition, in the case of linear regression indicator, the graphical construction is not true for arbitrary, it is a statistical calculation of the market values.
The details of the formulas to use for the majority of traders didn't, but I want to note that the Central line of the channel, called the trend a regression line is constructed between two points by the method of least squares. The other two lines are equidistant from trend in different directions.

As a result, it turns out the graph a price channel, formed by three parallel lines:
• the trend of the regression line;
• upper border of the channel;
• the lower boundary of the channel.
The use of the indicator linear regression channel
Such a tool could not remain without attention of traders so that it can be found in the work of currency speculators who prefer trading with the trend, and in the Arsenal of traders dealing on the rebound from the channel walls. As for principles, there is need to consider one important point, because we are interested in what will happen next in the market and not only what was already.
So, it makes sense when using this tool to take stock in advance and use filters. As an example we can consider the trading on the rebound, which is very popular among traders of the currency market. In this case, as filters can be any of the following conditions:
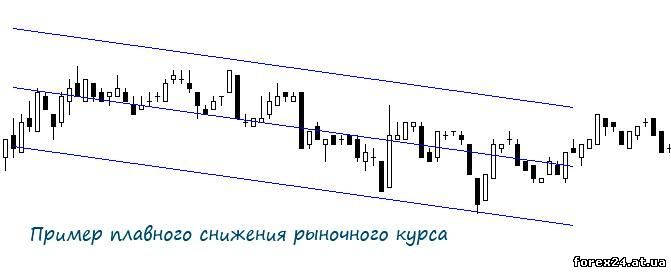
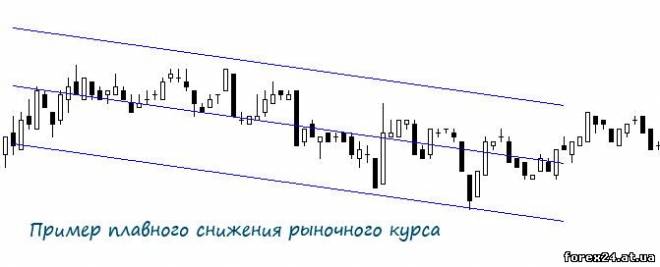
• currency pair, which is characterized by a smooth displacement rates (or continuously or at certain time);
• a time interval when a high probability of a flat market or just a smooth displacement rates.
There may be other filters, for example, an indicator that parts of the market state for a trend and flat. Of course, it will be useful only in case if the trader decides to trade exclusively in the flat. If sloping price channels is also considered as a convenient market conditions for transactions, the class indicator of a trend/flat will be useless.
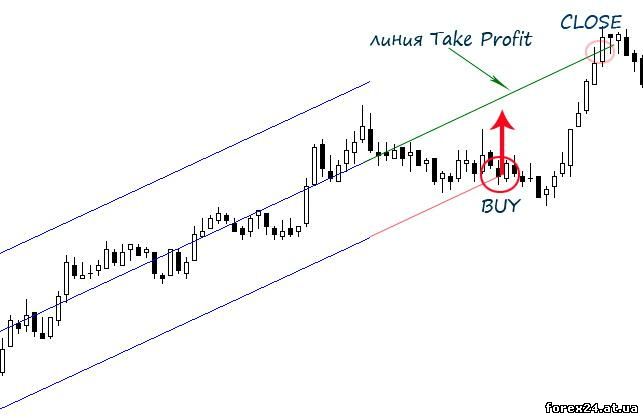
It is assumed that the price will continue to move through the channel if the circumstances satisfy the conditions, that is, the filter "give the nod". Since the indicator on the chart agrees to draw lines only to the current value of the market price, then visually continue the drawings themselves:
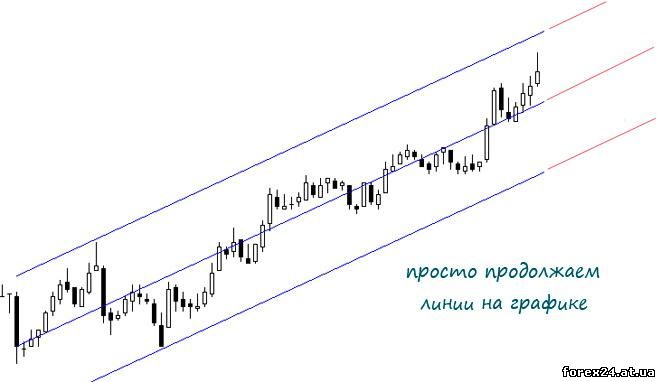
If the market price will touch the upper boundary, we conclude a deal to sell, and if it reaches the lower limit, it is necessary to purchase. In other words, trade is designed to return the price back into the channel. Some traders reject all agreements directed against the trend.
This means that in an uptrend the speculator will not open the sale even if the price touches the upper border.
The regression trend line can serve the purpose of the position. When the price touches this median line, the transaction is closed. You need to remember that if the position is already open, it is not necessary to rebuild the channel over time to see where exactly is the line of regression. For this purpose, better use standard tools from the terminal to finish the midline to the right.
The boundaries are equidistant and are calculated automatically, and the channel is constructed in such a way that prices for a selected time interval practically does not go beyond it.
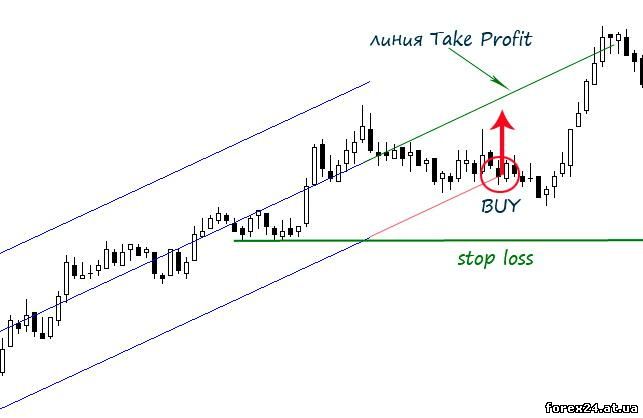
On completion of the currency transaction when the price touches the median line has been said, but we need also a mechanism for fixing the loss, if the transaction fails. Take fixed values in points is not effective, so we need the adaptive method, the use of which is justified in any market situation.
In this case, in my opinion, it makes sense to close a loss if the market broke previous support when the deal to buy or resistance level, when the position was up for sale. Overcoming the significant price level it is a signal to the fact that it makes no sense to wait for the return of prices to the channel.
The linear regression channel, though and is classified as price channels, but significantly different from many other options. For example, for comparison to see the Keltner Channel, which can be called more flexible, because it is not formed by straight lines and responds to changes in market conditions. However, linear regression can be useful in the trade, when we notice the directional movement of the market.
|
| Category: Forex | Added by: (05.11.2017)
|
| Views: 1117
| Rating: 0.0/0 |
|