|
Statistics
Total online: 1 Guests: 1 Users: 0
|
Trade
A Double top chart: how to find and use in trade
Most traders believe that success in trading is due to the large experience and long hours spent in front of a monitor. Of course, experience is an important component of a successful trader, but even beginners, with due diligence and care can successfully begin your career. And the market provides sufficient options to do this.
Such possibilities make it easy to understand what is happening in the market, include the so-called "reversal patterns" that signal the change of the mainstream.
They have long and successfully used by hundreds of thousands of traders around the world. In this article we will talk about one of them – the figure of the Double top.
How to identify a double top on the chart
Double top chart formed in an uptrend. To detect such a pattern on a chart is quite simple. It consists of the two maximums reach up to the support line. The formation of this figure is as follows:
• price draws the first maximum;
• then returned to the support line and bounces from it, forming the second maximum.
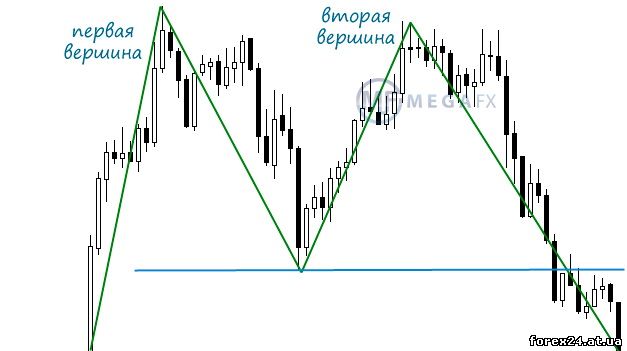
It is important that both maximum are at the same level, which confirms the weakening of the strength of bulls and completion of the uptrend. Recall that to talk about a bullish trend is possible only in case if the market are formed of successively higher highs and lows.
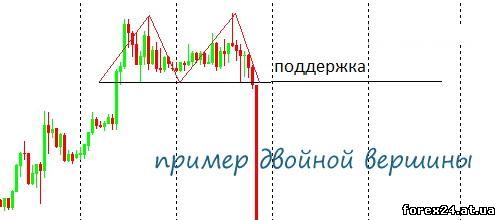
However, to judge the formation of a double top only on the basis of the appearance of two identical peaks impossible. Since it is a figure of reversal, we should wait for a significant signal that confirms the trend change.
This signal will be a breakout of the support line, which once bounced off the price. Once this line is breached and price breaks below, we can say that the market has turned.
It is worth noting that the figure "Double top" is a derivative pattern "Triple top". The only difference is that this pattern three peaks located at the same level. The break of the support line also indicates a change in trend from uptrend to downtrend.
How to use the double top chart
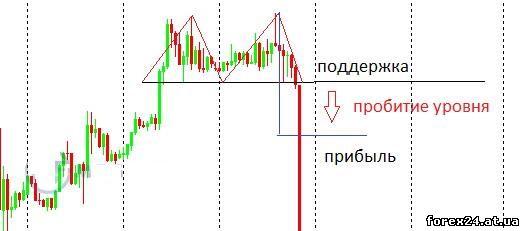
Double top is of practical importance for trade. This means that if you find it on the price chart, traders can think about opening trades for sale. It is important to remember that the signal for a trade entry will be the break of the support line. To use this pattern in two ways.
Entering a trade is carried out immediately after the price breaks the support line and fixed below. To determine how the price drops as follows: measure the height of the peaks and to postpone the same distance in points from the support line down. That is, at this level you can position potential profit.
The second method of trading by using shape Double top is subject to typical price behavior. Usually after the breakout the price for sure is testing it. This allows the trader to open a trade when the price will return to the broken support level and then jump.
To some extent this method can be called more "safe", because to open trade, the trader has at least three grounds:
• the pattern of the double top;
• penetration level;
• testing level.
To predict the potential profit possible, considering the distance from the top of the maximum level of resistance.
Thus, the basic rules of trading by using shape Double top (Triple top) the following:
• After the formation of a pattern should enter into transactions for sale.
• The position will be opened only after breaking the support level.
• Price must be fixed level or to test it.
• Potential profit corresponds to the distance from the maximum resistance level.
Reviews by other effective patterns:
• The pin bar
• Doji
• Butterfly Gartley
Double top at the bottom of the market
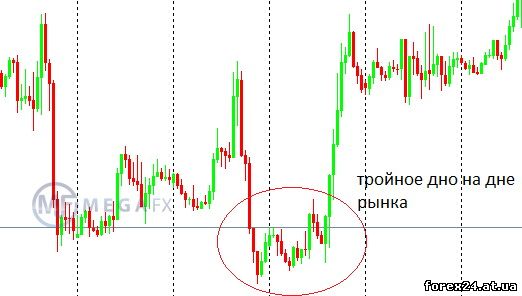
Double top chart, may also appear and at the bottom of the market allows them to trade when the trend change from descending to ascending. However, it is called "double bottom", but essentially it does not change.
At the bottom of the market, you can also find Triple bottom, which is a mirror image of the pattern "Triple top". The conditions of formation of these patterns mirror opposite of those that occur on an uptrend. After a long bearish trend, the price draws two equivalent minimum.
After forming the second of them the price breaks the resistance line rushes up and secured above the level. Now the trader can make a purchase.
Both methods of market entry will be relevant in this case. The same applies to predict the potential profit. Thus, a Double top chart will be very useful for finding market reversals.
|
| Category: Forex | Added by: (30.10.2017)
|
| Views: 420
| Rating: 0.0/0 |
|
