|
Statistics
Total online: 1 Guests: 1 Users: 0
|
Trade
Candlestick analysis
Candlestick analysis is a relatively young method of studying the market situation, which was not yet 30 years old. First candle formation was used in Japan, but the exact date of the appearance methods go contradictory rumors. It is known that Forex is obliged appearance of candlestick analysis in the Arsenal of traders Steve Nison.
It Neeson studied graphic interpretation of candlestick construction, and after published several books devoted to the enterprise method. His materials have been widespread among foreign exchange speculators that allowed candlestick analysis to take their place in trading.Candlestick charts are constructed in exactly the same way as bars. Important values in this method of market analysis are the prices of opening and closing of trading days.
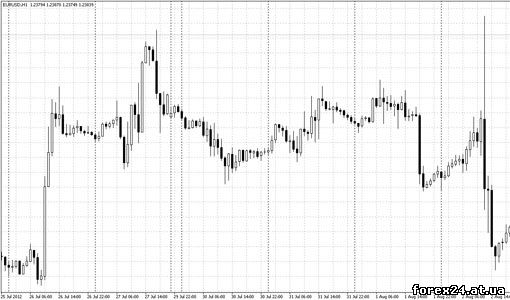
In Fig.1, you can see Japanese candlestick chart for EUR/USD. A black candle means that the opening price of this candle was higher than the price of its closure. White displayed the opposite growing options when the opening price is less than the closing price of the candle.

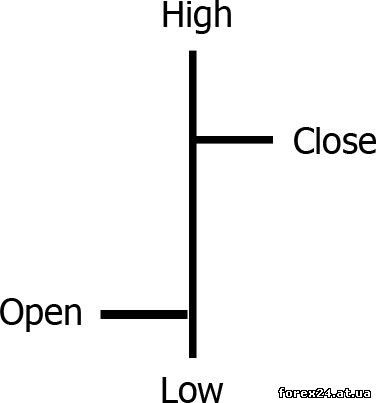
In Fig.2 is a closer look at the parameters of the candles, which help traders to analyze the market situation. For example, we assume that the Fig.2 the candle is the time. In this case, High corresponds to maximum price on the market over the past hour. Low opposite shows the minimum price, reached her last hours. Open is the first price value in the early hours. Close is the last price studied hour.

"Candle body" is the distance from Open to Low. If the body is black, it means one hour (our example for one hour) the market price has decreased, if the body is white, the opposite of growth is observed. Vertical sticks, one of which rises from the level High up and the other descends from the level of Low-down are called "shadows." They show the maximum and minimum prices during the study period.
Colors of bodies can be quickly visually determine the market situation. If we see several consecutive white bodies on the chart, you can immediately understand that the last time schedule ROS. Traders are exploring not just the Japanese candle on the chart, they learn their relationship with each other, sequences, shadows and so on.
Very informative turns of the market in the form of "body" and "shadows". So not difficult getting just by looking at the dynamics of the currency pair, immediately determine important price levels.
|
| Category: Forex | Added by: (30.10.2017)
|
| Views: 363
| Rating: 0.0/0 |
|