|
Statistics
Total online: 1 Guests: 1 Users: 0
|
Trade
Continuation patterns of the trend in Forex
On the market rarely develop the same type of situation as was seen by traders many years ago. Of course, this does not mean that two cases are similar to each other as two drops of water, but they will have certain common features.
After statistical testing of these observations, it comes to patterns. If You haven't seen this concept, here's a detailed explanation of what it is like to earn, and provides examples.
The model of continuing trends is a pattern that tells us that a high probability of further development of the market in the direction that you moved the price up to this point.
Usually continuation patterns of the trend are built manually on the chart by conventional lines Japanese candlesticks. The resulting shape is not in vain popular among traders because they have repeatedly proven the right to exist in the Arsenal of currency speculators. Now let us examine in detail what kind of a market model the continuation of the trend.
The model of the trend continuation - triangle
One of the most popular models is the triangle, which in turn is divided into three varieties:
• symmetrical;
• ascending;
• in a downtrend.
Symmetrical triangle differs in that its upper face is tilted down and the bottom up. There is a narrowing without ascent or descent, also some traders call side.
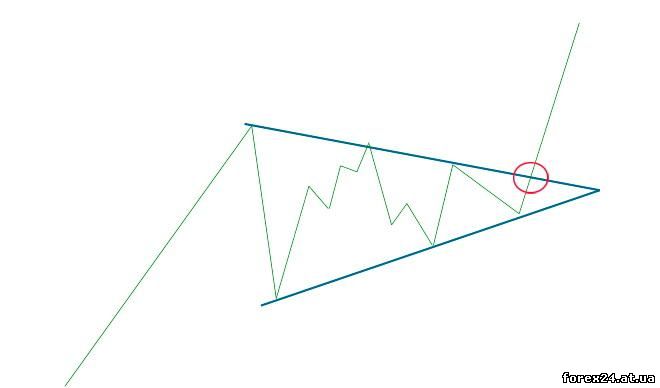
The other two varieties that is clear from the titles different from the symmetrical figures almost complete absence of the inclination of one of the lines. If you are talking about the descending triangle, the lower bound will be almost horizontal, and if upward, then the same situation will be relative to the top border.
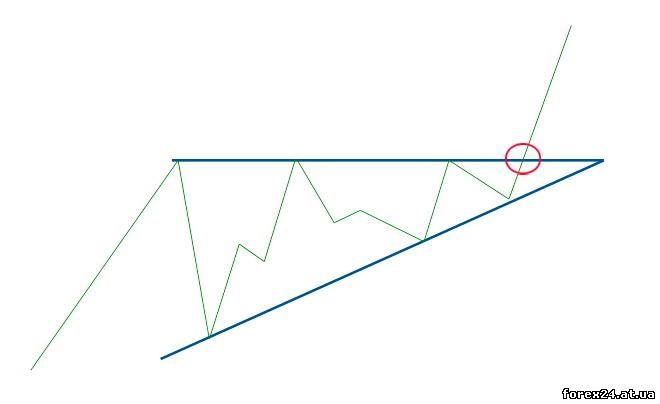
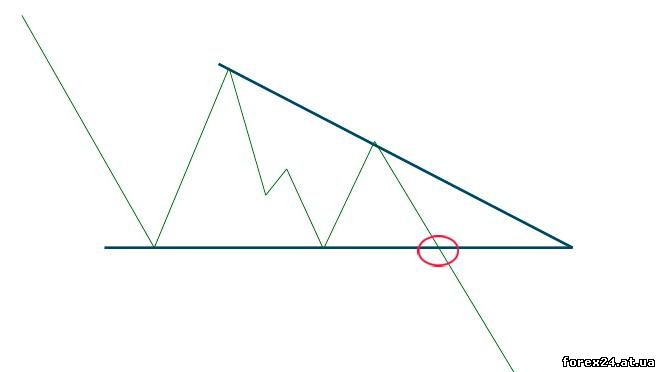
Before the formation of this shape on the chart first clearly noticeable trend movement. The market is shrinking, we are using a conventional lines MetaTrader 4 draw a shape. In this situation, the price usually abruptly breaks the boundary of the triangle and is directed in the direction that there was a trend towards a pattern is formed.

However, the opinions of the traders subsequently divided into two points of view:
• break out of the boundaries of the triangle will be exactly in the direction in which the developing trend;
• breakdown of the border can be any of the sides, but it will definitely be strong and will allow us to determine the direction of price movement at a large number of points.
In this case, I suggest You independently assess the situation and make its own decision. However, if the boundary of the triangle breaks, it's a really powerful signal, which will move the price. This phenomenon in financial markets is called "the calm before the storm", meaning that the narrowing of quotes results in a sharp trend move.
Continuation of trend - flag the model
Another popular model that helps to understand the traders in the market, further, that "Flag". Built this pattern as well with conventional lines such as the popular MetaTrader 4. The figure consists of two parts:
• the base (the pole);
• cloth (the flag).
Found this pattern not less than a triangle, so it is advisable to pay attention to it and use in trade. First of all, let's see what is this pattern, what is its model:
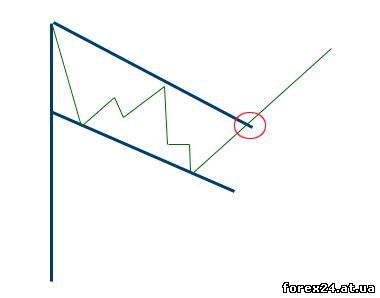
As you can see, we need some long candles that will serve as a basis. Then, there is a market correction, and if the conduct of local maxima and minima of the two lines, we get the canvas. It is believed that the high probability of breakdown of the line flag that prevents further price movement in the same direction as when forming the base of the figure.
Not difficult to guess that if the basis of the pattern is directed downwards, the figure can be called a upside down flag. It turns out that the rules of construction mirrored the growth of the base and when it is falling.
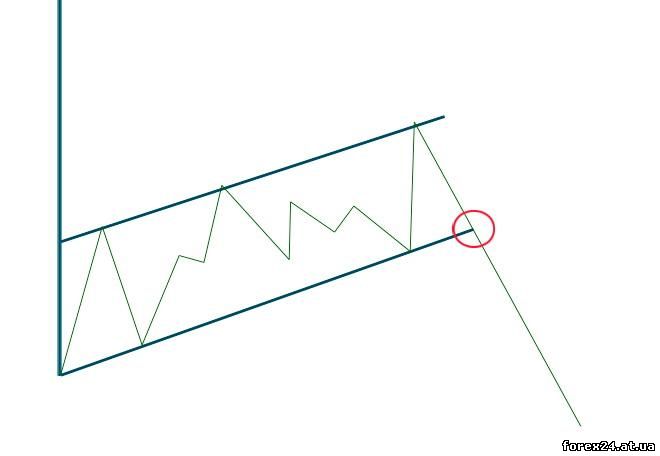
Data the market model the continuation of the trend is not just a way to get more information about the market, and full search methods are the entry points. You will immediately see, when you want to enter into the agreement as a signal for the opening position in both cases is to overcome the line on the graph.
As in the case of a triangle, a pattern flag is also interpreted in different ways. If some traders believe that you should enter into transactions only in the breakdown of the boundaries that allows the market to move in the direction of the base, then other speculators any intersection of the lines of the flag mistaken for the signal for the conclusion of the transaction.
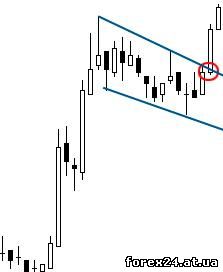
With regard to currency pairs and time frames in which these patterns manifest themselves especially good, I recommend to pay attention to the TF from M5 and higher. Usually continuation patterns of the trend on Forex are used in day trading, this means that the most popular TF will remain the M5 and M15. About the currency pair to say almost anything, because there are no limitations, these models can be used on any instruments that can create market conditions for the construction of figures.
|
| Category: Forex | Added by: (05.11.2017)
|
| Views: 639
| Rating: 0.0/0 |
|