|
Statistics
Total online: 2 Guests: 2 Users: 0
|
Trade
Divergence in the Forex market
What is the divergence? This divergence of the indicator with the current market situation (price behavior). With its help traders looking for peaks in the market. It is formed in those moments when the growing market, bulls have no strength to push the price further up. And bear when sellers can't push price down.
Try to imagine this with a simple example with the car. The car rises up the hill, the road goes up with a slight slope, and the driver keeps the speed of 60 km/h throughout the climb. The tachometer shows 2500 engine speed per minute.
At some point the car climbs a hill and begins to move forward on a flat road without incline. The number of revolutions of the engine remains the same 2500 rpm, but the speed increases to 80 km/h.
Even if the street is night and the driver did not see the location, then according to the speed indicators and tachometer, it can be concluded that the road has no slope (or significantly decreased). In this case it is the divergence. The number of revolutions of the engine remains the same, but the direction of the upward movement (tilting) has ended.
Now we understand that this divergence, and then we will look at:
• how to find her on the charts of currency pairs;
• what kinds of it are;
• what can help us find the divergence;
• what other issues related to "diver", we need to take this into account.
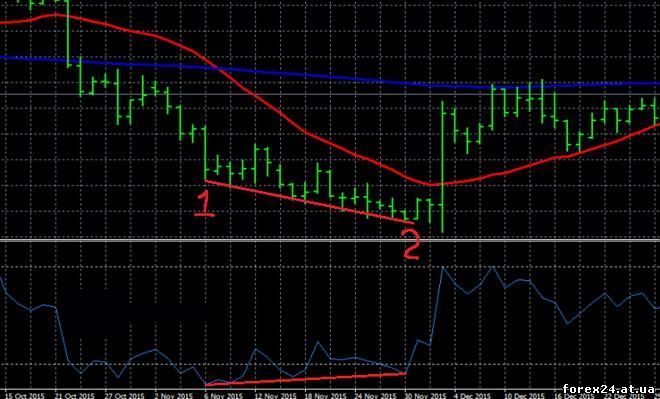
Let us consider the daily chart of EUR/USD. In point number 1 of the sixth of November, the price formed a new low and this point was confirmed by new low indicator and the relative strength index (RSI review).
After that, the down trend continued and in the point 2 (the thirtieth of November) the price has formed at least once. However, this was not confirmed by the indicator of relative strength index, which was higher than its minimum, formed on 6 November.
In this example we see that in some point of the indicator does not begin to match the prevailing market trends. This is the time when the trader should be very careful to try to use the resulting divergence to enter the market.
The chart above shows that the result of this divergence was a powerful break up.
The situation when the price chart forms new low after the previous, and the indicator takes a value higher than the previous low, is called a classic bullish divergence.
Now consider the reverse situation.
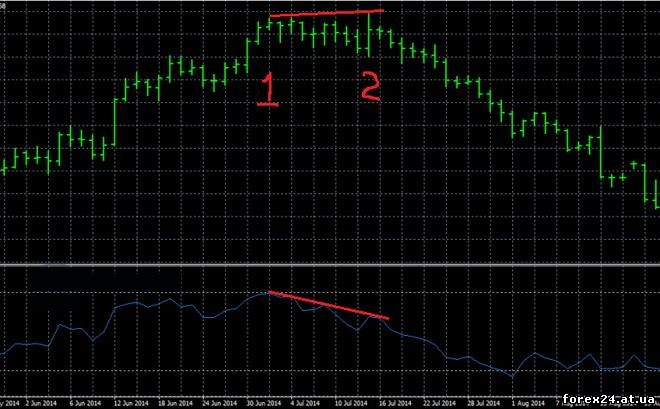
Daily chart of GBP/USD. At the point under number 1 of the second of July, the price formed a new high. This point was confirmed by a new peak indicator relative strength index (RSI).
Price movement upwards has been continued and a new high was formed on 15 July (at the point on the chart at number 2). However, this was not confirmed by the RSI indicator, which was below its maximum, formed on 6 November. As we can see, the result of breaking the price down began a new bearish trend.
Appeared the dispute that is called a classic bearish divergence. It happens when price on a chart forms a new high, after the previous, and the indicator takes the value below the previous maximum.
A couple of useful reviews of trading:
• Tick volumes
• Hedging
What else you should know about divergence
Look for divergence we can use most of the indicators, such as stochastic or MACD. Similarly, we seek it on any other instruments. For example, the chart of gold or CFD's.
In the above examples we saw the situation with the classical divergence.. But there are more sophisticated ways, for example, the concealed and the extended divergence. It is more difficult to detect on a chart and they are much less used by traders as a signal to enter the market.
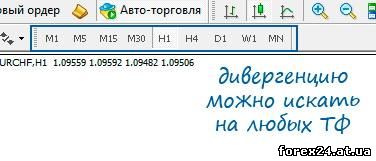
Divergence formed on the charts of all timeframes, for example, fifteen-minute, hourly, daily, weekly and even monthly. Note that the above used to find the divergence, the timeframe, the greater the potential price movement should be expected by the trader.
The appearance on the chart any divergences does not mean that now is the time when the dominant trend is broken and will change its direction, but the situation tells the trader that it needs to be very careful. Perhaps we should reduce the position size when trading with the trend and be ready to quickly "turn over" at a time when the price will confirm that the time has come for this.
As with most indicators, the signal of entering the position will be stronger when price is in trending movement, not sideways.
You have to find the kind of divergences which will bring You maximum profit. For example, I suggest You read how to use the MACD divergence to trade in Forex.
|
| Category: Forex | Added by: (30.10.2017)
|
| Views: 433
| Rating: 0.0/0 |
|
