|
Statistics
Total online: 1 Guests: 1 Users: 0
|
Trade
Figure Head and shoulders: how to find the chart and to trade
Imagine three mountain peaks that follow one another. The mountain, located in the center, above two extreme, and they are about the same height. On the chart, this formation is called the figure Head and shoulders.
Extreme peaks represent the shoulders and head of the Central hill, it should always be above their neighbors. The purpose of this figure in determining the end of the current trend and market reversals in the opposite direction.
This pattern is popular due to the fact that shows a high percentage of accuracy signals. There is in this formation and so-called neck, which is the line connecting the two base of the head.
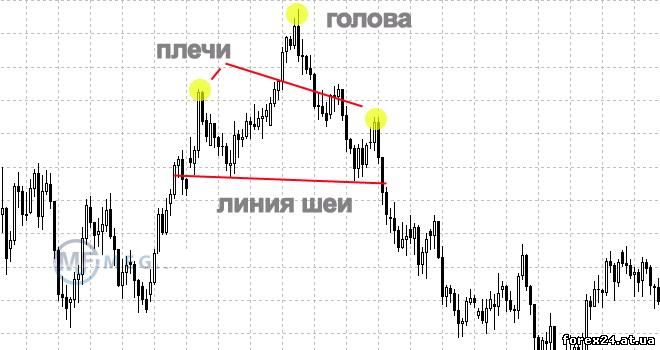
When there is a breakout of the level of the neck after the second shoulder, it confirms the presence of the figure.
Figure Head and shoulders in trading
Entry points are determined by the position of the line of the neck. When the market falls below this level, after forming the second shoulder is considered to be the signal for the opening position. You can also define the level of fixing a profit on the transaction, which is measured by the height of the head.
Measure the distance from the topmost point of the main hills to the neckline. Then, the same distance we take off down from the neck line. About that long has to be a movement at least. The previous illustration shows an example of the figure, which marked the Head and shoulders and neck line.
The following illustration shows the same graph as in the previous times, only on a smaller scale. It shows how determined the levels of entry and exit. When input signal is opened the transaction for the sale of an asset, as it is expected that the market will move down.
The chart also marks the exit point of a position which, as we have seen, was responsible market behavior. Output, measured by the height of the head, showed the best time of the closing of the transaction.
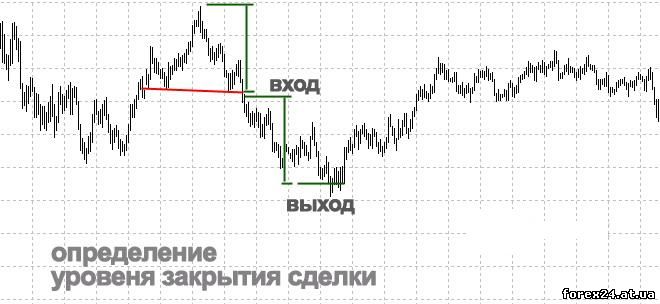
Figure inverted Head and shoulders
Like a regular pattern, there is a figure Inverted head and shoulders. This is a complete analogue of the standard formation, just flipped 180 degrees. The following illustration is an example. Now the trend is changing from descending to ascending.
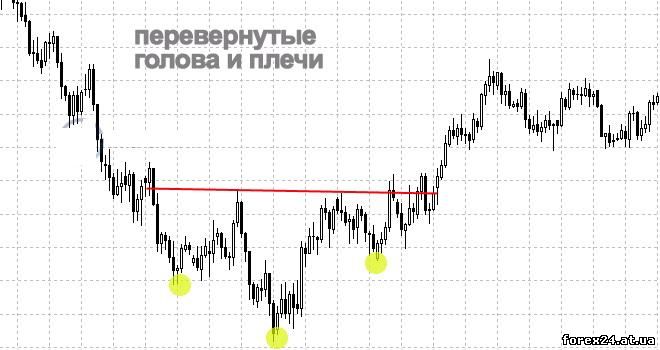
The trading principle of the inverted pattern is the same as last time. You need to find the entry point that is a crossing market, the level of the neck. At this point the purchase of the asset.
When the market rises to a level equal to the size from head to neck, the transaction is closed (see illustration). Please note that this time the closing of the transaction is profitable.

As in the case of the usual shape, and inverted, the price may continue to move in a prescribed direction after reaching the point of closing the position, which could bring more profit. Many traders there is a desire to set other output levels, but this is risky.
Do not be greedy, because it is one of the destructive factors in trading. Stop loss is set slightly above the second shoulder, and in an inverted shape, in contrast, is below.
We distinguish these two patterns:
• ABCD
• Butterfly Gartley
explain the behavior of the market
To have greater confidence in the figure of " Head and shoulders, will examine why it signals about the trend reversal. When the market is making the form of the higher peaks of the three, and then falls back down, forming a right shoulder, this suggests that sellers take the initiative.
At the same time, the volume of purchases reduced. At the moment of reaching the market of the neckline, traders who bet on rising prices, begin to close their losing positions. Bulk sales lead to lower market.
Neck line is the level at which most traders cannot withstand the pressure from the open losing trades. As a rule, the scope of their sales market enough to reach the take profit level.
The stop loss level that is above the top of the second leg is selected based on the market direction changes. Until the start of the continuation of the uptrend, the top of the right shoulder fail.
Disadvantages of the pattern Head and shoulders
Like any other pattern of behavior of market prices, the figure Head and shoulders does not give a guaranteed result. Among the disadvantages - duration of the pattern formation. It will take some time until formed formation to the end. And before after the second shoulder there is a breakdown of the level of the neck, we can only wait and see. Moreover, it is not always the market reaches the take profit level, the trade is not complete without working with stop loss.
A considerable problem is also the fact that the figure doesn't always look perfect as it is possible to imagine. One trader will see on the chart this formation, and the other not. It is difficult to establish in this respect a single standard, which will be true for everyone, regardless of their perception.
|
| Category: Forex | Added by: (30.10.2017)
|
| Views: 412
| Rating: 0.0/0 |
|
