|
Statistics
Total online: 1 Guests: 1 Users: 0
|
Trade
Hooks Ross - an overview of the pattern and the method of application in trading
Among the many trading strategies used for trading on Forex market, we should also distinguish those that belong to the category of Price Action. Their distinctive feature is the ease of use that allows you to apply this system even beginners.
All you need to do the trader - to learn and remember the pattern on the chart, which is the signal to enter the market. The simplicity and efficiency of the trading strategy the Price Action method are highly valued among traders.
Hooks Ross – one of the most popular strategies in this category. The author, Joe Ross, made their first steps in the commodity market, after which he engaged in stock trading, which has pioneered its strategy.
Subsequently, the hooks Ross began to use in the FX market, albeit with some reservations. Thus, the best strategy results demonstrates in the stock market, but the thoughtful approach it can be successfully applied on Forex.
Hooks Ross
First you need to find out what the "Ross hook" and how to find it on the chart of the currency pair. Hooks Ross – not that other, as the formation of maximums (or minimums) next to each other in sequence. Pattern is found at the end of the trend and indicates that trend in the market has changed. How is this hook?
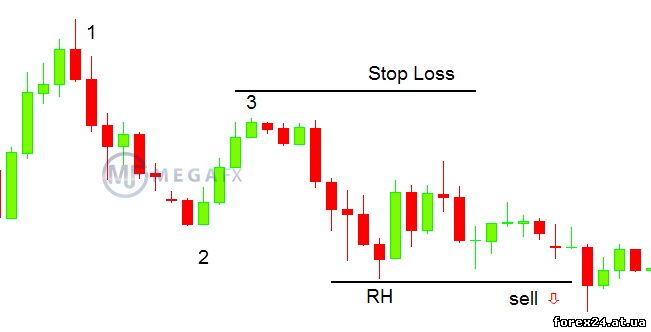
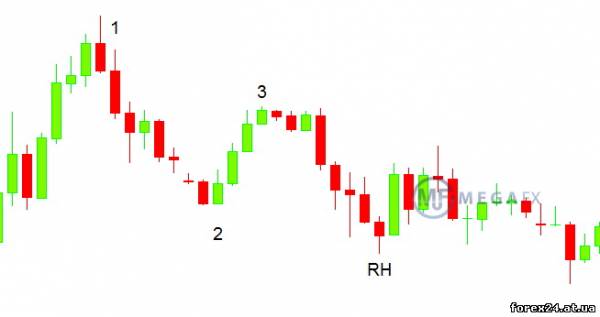
1. In a bear market formed another local minimum (1).
2. Pullback is observed, which generates a maximum of (2).
3. Generates the following local minimum (3). As a rule, it is formed above or on the previous level, which indicates a weakening of the strength of the bears.
4. Appeared after this local maximum becomes the point of formation of the hook (RH). To ensure that the point RH(Ross Hook) do like this is, you need to make sure that this new local maximum, and that the next three candles are above her level.
Came the 1-2-3 formation-RH is a Ross hook. To define a pattern on a chart is quite simple, so even beginners can easily use the technique in their trading. The appearance of the pattern indicates that the price can not form a new high or low, corresponding to the existing trend. In a bull market, everything is exactly the opposite:
1. Formed a local maximum (1).
2. Rolling back prices, formed a local minimum of (2).
3. Followed by a local maximum of (3).
4. Point of the formation of the hook will be the next local minimum (RH).
For a trader it is important to identify the 1-2-3 pattern formation, which hints at a possible change of direction of the price movement. After that you should wait until the point of formation of the hook, and open order to buy or sell.
Trade the Ross hooks
Ross hooks can be used in trade directly on the market, and working with pending orders. In the first case the entry into the market is as follows (buying in a downtrend):
1. The price returned to the point of forming a Ross Hook.
2. Stop Loss is set near the low of the pattern.
3. Take Profit is calculated using the Fibonacci Expansion tool, applied to the model 1-2-3.
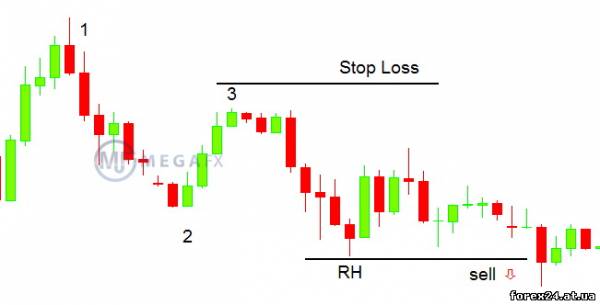
To open sell orders, the situation is reversed.
The use of pending orders will save considerable time of the trader, eliminating the need to track changes on the currency pair chart. Pending order is set for the point of RH after it is formed. Protective Stop Loss order should be set for a extremum of (3). To determine the potential profit you can apply Fibonacci Extensions, as well as levels that were previously punched price.
Still recommend these tools:
• Andrews ' Pitchfork
• The pin bar
signal Filtering
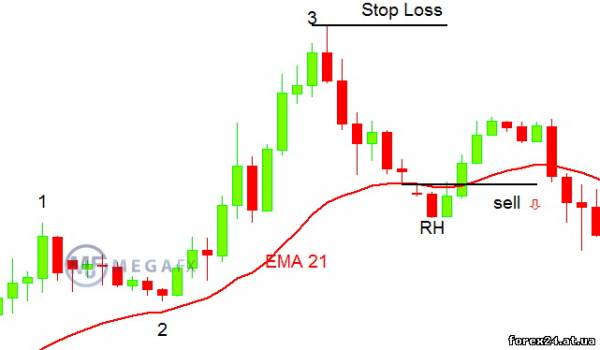
As mentioned above, the hooks Ross give the most accurate picture of the market shares. The foreign exchange market has its own characteristics, therefore, for more accurate entry into the market, traders prefer to use additional filters. Combining the hooks and one of the built-in terminal indicators, it is possible to reduce the number of potentially losing trades and increase profits from them. For example, it is possible to use a moving average.
The use of EMA 21 allows you to enter the market when it comes into force. During an uptrend the graph is above the moving average. Signal to open a position would be to return prices to the level of key bar EMA overlaps with the schedule.
Stop Loss is set at minimum (maximum) of the correction movement, and to determine the Take Profit is used as a rule, Fibonacci Extension.
Some traders to work with the Ross hooks using indicators showing overbought or oversold market, such as Stochastic, allowing you to filter out false signals and more confident to enter the market.
To learn how to quickly determine a pattern, you will need some time. It often happens that beginners consider unnecessary the fact that it is not. This leads to the establishment of incorrect orders, and following this loss.
You need to remember that the hooks appear only in trending markets at the beginning of the price movement. Allocate the hook on a rising market is when it was preceded by a pronounced downtrend, and Vice versa.
|
| Category: Forex | Added by: (30.10.2017)
|
| Views: 342
| Rating: 0.0/0 |
|