|
Statistics
Total online: 1 Guests: 1 Users: 0
|
Trade
How to use Fibonacci fan
The great mathematician Leonardo of Pisa, who studied with Arab mathematicians, known primarily for his sequence of numbers and "Golden section". His work was used by many mathematicians of different countries, and received their place in theories about the universe.
In the foreign exchange market the Fibonacci ratio 1.618 as actively used, for example, in building levels (0; 38,2; 50; 61,8; 100).
One of the most popular trading terminals for Forex trading is MetaTrader 4. Even after the release of the new fifth version, the MetaTrader 4 is the most popular among traders. So, in the standard set of programs for technical analysis there is even a group of tools created from a large theory mathematics.
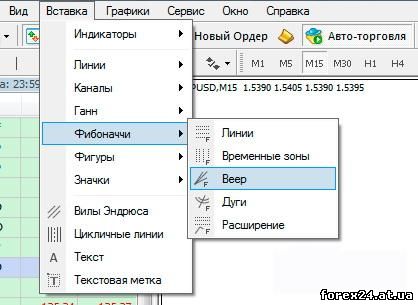
Among the options are a Fibonacci fan, which allows you to quickly build on the graph sloping price levels to determine the market correction. The essential difference between fans from the same price levels of Fibonacci, called the terminal lines?
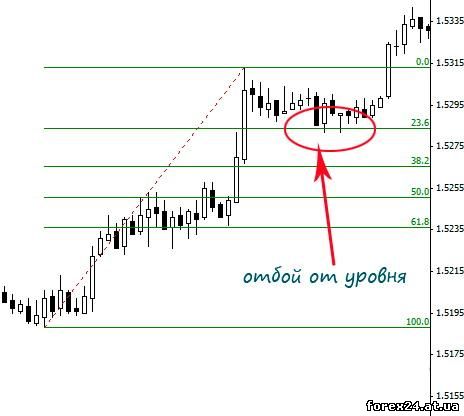
Remember that the lines are horizontal, i.e. they do not take into account the time factor and only provide information that the price is approaching these levels, most likely reflected in the opposite direction. The downside, in my opinion, is the lack of consideration of time, because the market may reach the level of 30 minutes a day, do the values of price levels does not need to change?
The Fibonacci fan tool, on the contrary, takes into account the passage of time, as the inclined the price levels are arranged on the chart, gradually rise up:
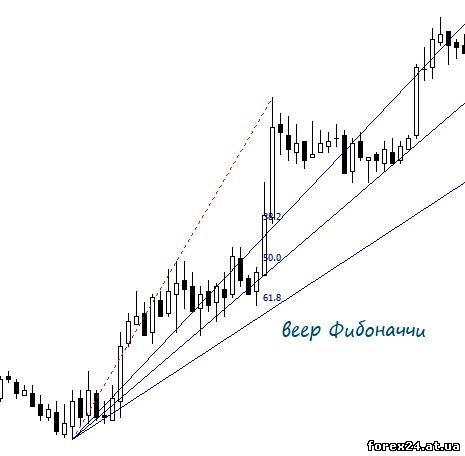
In this case, the logic follows that the longer the market price is not suitable to the Fibonacci levels, the more likely the imminent market correction. The fan consists of three lines corresponding to the values 38,2; 50; 61,8. How were these values obtained how to use the Fibo fan, look on.
Use Fibonacci fan in Forex trading
To begin with, where did the values for the price levels of Fibonacci, which we will see when constructing the chart. You need to remember about the Fibonacci sequence: 0, 1, 1, 2, 3, 5, 8, 13, 21, 34, 55 and so on, which is based on a simple principle, each new number is sum of previous two.
• If we divide any number in the sequence by the number that stands right through one number, such as 21/55, we get 0,3818.
• If we any number in the sequence, divide by the number of standing, for instance, 34/55, we get to 0.618. etc.
In the chart all values are presented in the form of interest, but because we see the 38.2% of 0.382. It is believed that these ratios directly apply to the "divine proportion" is found in almost everything that exists in our World (but that's another story).
Now propose to consider how to use Fibonacci fan in Forex trading. For this we need a significant price movement, the development of which has stopped and started a correction.
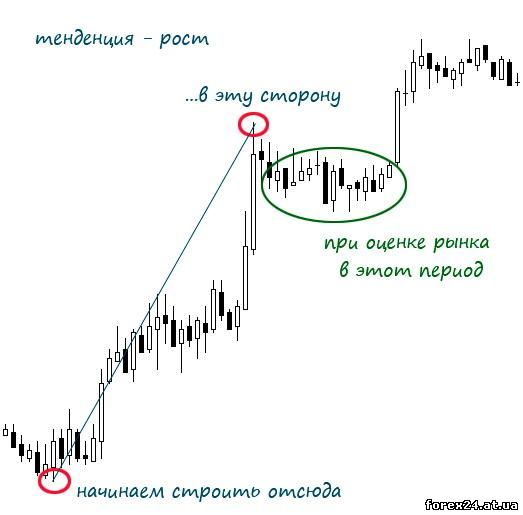
To build all the figures, the support should be only in the direction of the market trend, this means that for example in the illustration above, selecting fans first, put the cursor on the bottom starting point of the trend. Then, holding the mouse button pointing the cursor on the outermost point of the second side of the price movement and release the button.
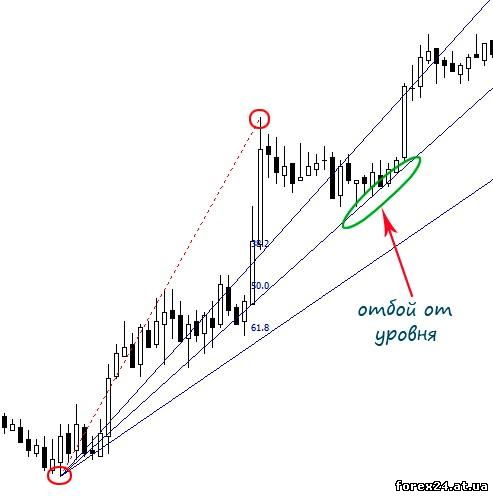
The result is a dotted line connecting the two points referred to us, as well as three sloping price level, and next to them are their values. The market reversal from the 38.2 line is a relatively rare, such a retreat can only be observed during strong market trends, when correction is not large.
In most cases, the price turns back in the direction of the trend on which we have built the fan, at levels 50 or the 61.8. If the market breaks above the 61.8 and is fixed at this boundary, the more probable is a change in market trends. In other words, better not to expect that the market will turn, and prepare for a full reversal.
Fibonacci levels are traditionally used in Forex to find potential points of market corrections. The fan is just one of the tools created math time, however, its important difference is the timing. If we discard the question of the relevance of price levels, it is possible to use a conventional horizontal Fibonacci lines.
|
| Category: Forex | Added by: (05.11.2017)
|
| Views: 761
| Rating: 0.0/0 |
|
