|
Statistics
Total online: 1 Guests: 1 Users: 0
|
Trade
Indicator X-Lines for MetaTrder4 Forex
Difficulties with the ruling price levels there are many traders, especially when a speculator notices a certain subjectivity in assessing the market situation. Didn't notice that the same diagram can be lined in different multiple traders? But it is true.
X-Lines helps you quickly determine price levels, and objective manner, and not on the eyes. Below You can download the indicator X-Lines for MT4, and you will find the description of the program.
Start with the fact that the algorithm was originally developed for MetaTrader 5, so that the network is under the terminal you can find the largest number of proposals for the jump. Then the program was moved to the more familiar for most currency speculators MetaTrader 4.
Description of the indicator X-Lines
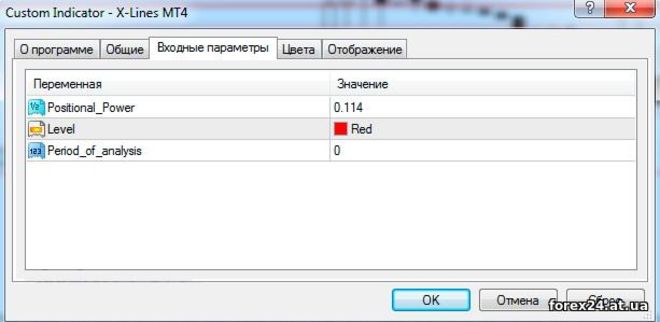
The program contains a fairly limited number of settings, so the variables don't get confused:
• Positional Power - the filter that allows the selection of levels (for example, only the most significant will appear on the chart, or all in a row);
• Level - set color of horizontal lines;
• Period of analysis - depth of history that the indicator uses to calculate values.

I recommend to start not to change anything in the settings (except color, of course), and see how the analysis of the selected chart. Please note that the markings change when switching time frames, so look for price levels should on the TF you use in your trading.
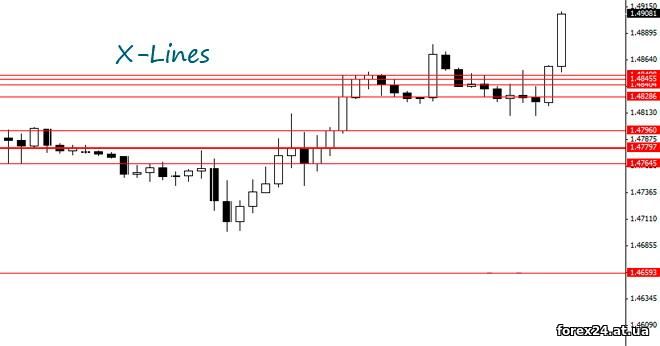
Now let's talk about horizontal linesthat appear on the chart. The most important level, as You may have guessed, represented by a thick line, and secondary levels are offered in the form of thin lines.

If the current value of the market price is below the main level, a specific indicator X-Lines, this level is resistance. In the reverse situation, when the price is located above the line, we are talking about the level of support. Read more support and resistance I recommend to read here.
In the previous version of the indicator you can configure the filter Positional Power for the primary and secondary levels separately, but in the future the author of the algorithm abandoned this function. The fact that, in practice, the vast majority of traders have become all the horizontal lines, drawn with a program, perceive equally, while highlighting the main level.
The use of the indicator X-Lines
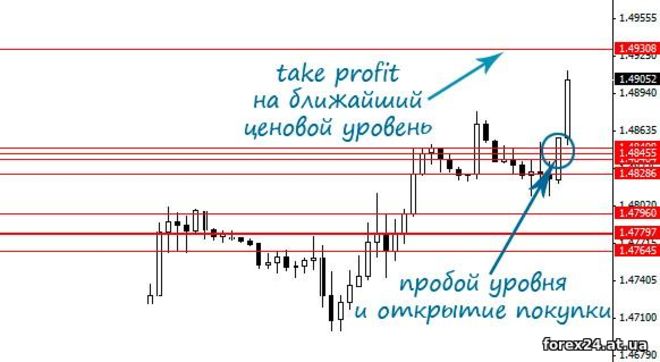
Found with the help of indicator levels can be used in a variety of ways, will depend on the selected trading system. Fans of deals on a retreat in the flat will probably prefer to use the X-Lines to locate places likely price reversal. On the other hand, if we prepare for trading on the breakdown, so you can use the levels of X-Lines.
Here are a couple of trading systems that opalino to integrate this algorithm in order to find important price levels:
• Channel breakout in Asia
• Breakthrough strategy
In section trading systems can be found options transactions on the retreat, in fact, the X-Lines will help us in this kind of trading. Agree that at the end you must first formulate, and then to determine on the chart what will "fight back" (to make deals in the direction of the price reversal).
The algorithm X-Lines does not dictate any rules and conditions for transactions. It is a tool that allows you to quickly find an important chart price levels and are determined each time by the same method, which is very important for systematic trading.
These horizontal lines are used to place orders take profit and stop loss. However, application rules remain the same when feet are placed on levels, and take profit set or level before, or right at it.

The indicator is easy to use and can help in the analysis of the market situation. Such algorithms are often referred to as a commodity, and the information, that is, to help you better understand the current situation. Serious disadvantages of this algorithm, in my opinion, no, it's pretty well cope with the task set before him.
|
| Category: Forex | Added by: (06.11.2017)
|
| Views: 1340
| Rating: 0.0/0 |
|