|
Statistics
Total online: 1 Guests: 1 Users: 0
|
Trade
Indicators of the group of oscillators in Forex
Oscillators in Forex is the second largest group of indicators after trending tools for finding more accurate signals and filtering of potentially dangerous situations.
The concept of oscillator traders borrowed from physics, where this term refers to a system that makes repetitive fluctuations. It could be argued that in financial markets observed the same regularities, as in the physical world, but the main difference of the oscillators in Forex is that the cyclical fluctuations observed in their marking, is not due to the impact of certain laws, and is achieved using special mathematical formulas.
Examples of oscillators in Forex
The main purpose of any oscillator is to identify the conditions oversold and overbought, i.e. situations when the market price deviates significantly from its average value. At the same time to eliminate uncertainties in the process of searching for such signals all the oscillators are equipped with a special standardized scale whose values range from 0 to 100 or from -100 to 100.
A classic example of the oscillator in Forex is a famous Stochastic, the full name of which is pronounced – "stochastic oscillator". Outwardly, he is a wave-like structure whose values range from 0 to 100.
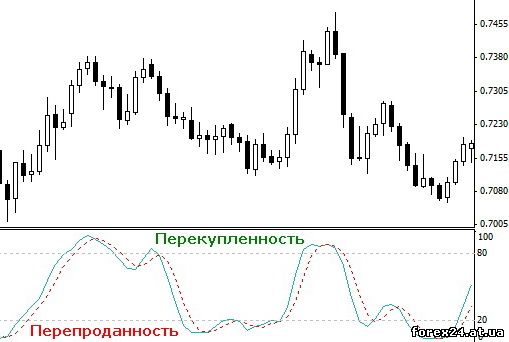
It is believed that if stochastic lines are in the region from 0 to 20, the asset "oversold", but when the value of the indicator is enclosed in the range from 80 to 100, can we talk about "overbought" trading instrument.
In General, the concept of oversold and overbought is quite relative, as different time frames, the markup will vary significantly in the same period of the indicator calculation. Apparently, this is the similarity between the oscillator in Forex and physical process, so as to identify patterns trader, as a physicist, I have to perform a lot of measurements and experiments.
But once discovered the physical law remains relevant at all times, the duration of the market cycle is always changing, so you have to regularly update the statistical database and make corrections, than almost none of beginner speculators are not involved.
Another classic oscillator on Forex, RSI, better known as the "relative strength index":
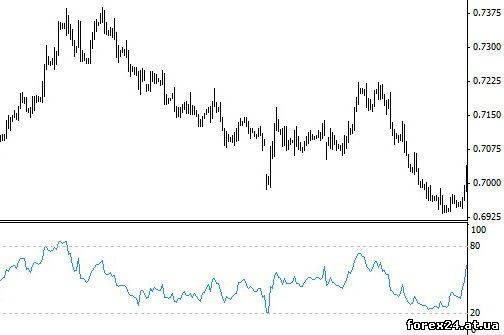
He looks very similar to stochastics, but if the first indicator compares the current price with the range of fluctuations during the selected period, the RSI compares the average values of positive and negative price changes over the period.
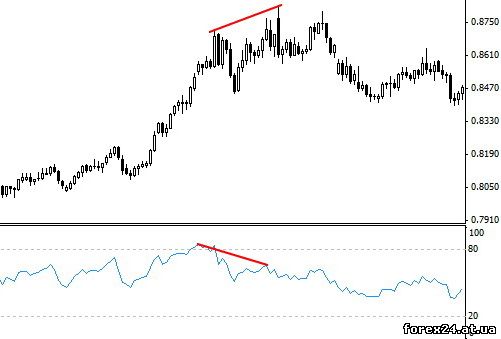
In addition to critical States, often looking for RSI divergence – divergence between the dynamics of prices and indicator. For example, if a currency pair has updated the maximum and the new maximum of the indicator below the previous one, you can make the assumption that the current price has risen very high with respect to its normal value.
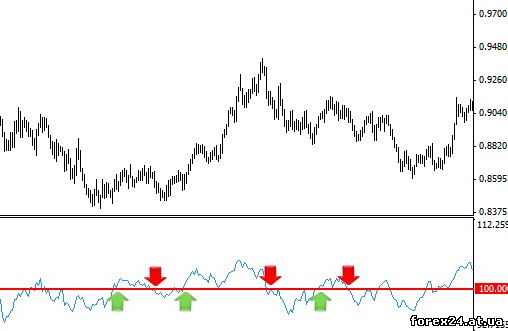
The least popular oscillator Forex Momentum, which is calculated by dividing the current price by the price of the candle, were several periods ago.
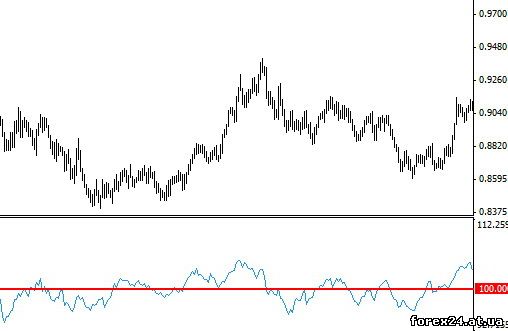
"Momentum" has several features, in particular, its value is around 100, but the scale does not have a standard overbought/oversold, so traders determine state data independently (from my own experience, of the calculation period and timeframe).
In addition, the indicators, like Momentum, are commonly used in Forex to search signals in a direction crossing the 100-level notes:
Reviews three more popular oscillators:
• MACD
• Gator Oscillator
• Awesome Oscillator
Original oscillator for financial markets
To list these oscillators for Forex can be long, but they are all very similar, and therefore, when the same calculation periods, generate almost identical signals. Much more interesting in this respect, the algorithm is called "Money Flow Index", which translated to English means "the index of cash flow."
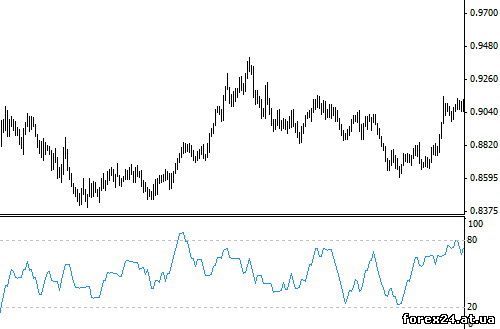
He looks very similar to RSI, but it takes into account the value of tick volume which, albeit far from the real trading volumes, but allows you to make an amendment to the trading activity. Used MFI is similar to RSI, but his signals are more accurate.
And the last group of oscillators in the foreign exchange market expects volatility. Unlike all the above indicators, the main challenge of such algorithms lies not in finding the critical conditions of the market and reduced to measuring the amplitude of price fluctuations. The most famous representative of this group – ATR.
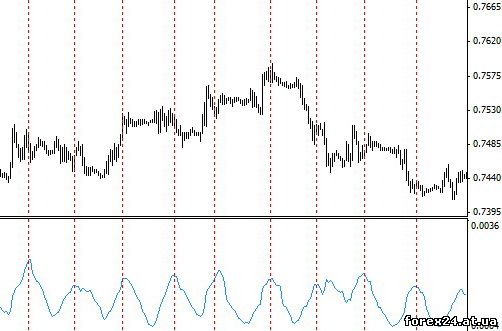
As you can see, the ATR value grow during the expansion of the price range, that is, regardless of increasing or decreasing the price, price fluctuations is recognized on the module.
Another similar indicator named after its Creator – we are talking about the oscillator Chaikin's volatility (CHV abbreviated). It looks like this:
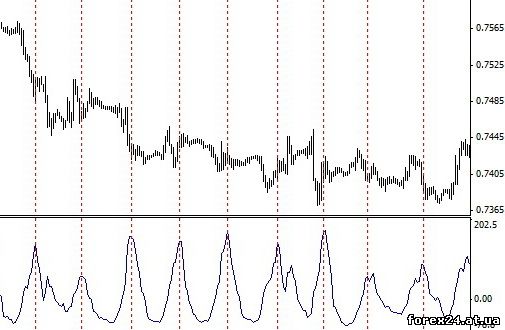
Download the famous Chaikin's oscillator, You can here:
CHV performs exactly the same task as the ATR just a bit different formula of calculation. Which one to choose – each trader decides for himself according his own understanding of the situation on the market.
Thus, the oscillator on Forex is an integral part of the analysis, as they can be used not only to look for signals but also to estimate the amplitude of price fluctuations. The only drawback of such algorithms is the so-called "sticking", that is, the state when the indicator line for a long period of time is above/below the boundaries of the overbought/oversold.
|
| Category: Forex | Added by: (06.11.2017)
|
| Views: 375
| Rating: 0.0/0 |
|