|
Statistics
Total online: 1 Guests: 1 Users: 0
|
Trade
Investing in the Forex market
We continue the conversation about what is possible and often necessary to pay attention to when choosing an object for investment. Indicators can be too much, but not all of them are available in a particular case. Sometimes you have to settle for the information that leave is available for the controller or the PAMM system different DTS. Let me remind you that there are more first article on investing. Consider first graphic sources of information. Let's start with the curves and balance of funds.
Yield curves
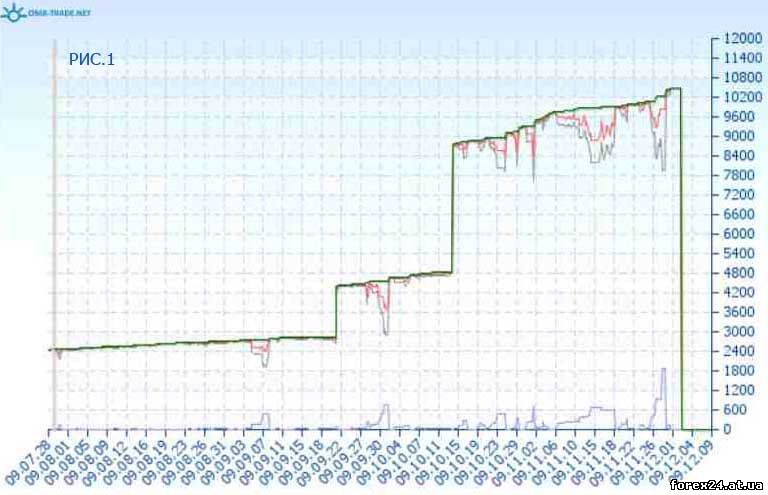
Often an investor has the opportunity to explore the curves, the balance of the account that interested him from the point of view of the ability of cash investments. Consider the following example taken from the service monitoring onix-trade.net. In Fig.1, we see green and red lines. In this case, the green line reflects the dynamics of balance, and red for a trading account.
If a trader opens a deal, and she is at a loss, but it still is not fixed, i.e., not closed the transaction, then equity curve account will not coincide with the balance curve. The fact that the balance may change only after the bargain is closed.
Accordingly, if the position was closed with loss, you will see a decrease in the balance on the account, and the green curve to decrease slightly. The red curve reflects the dynamics that is deposited. What it gives us. First, if a trader does not close a losing position and waiting for when the price returns to a profitable deal for the area, then graphically we will see.
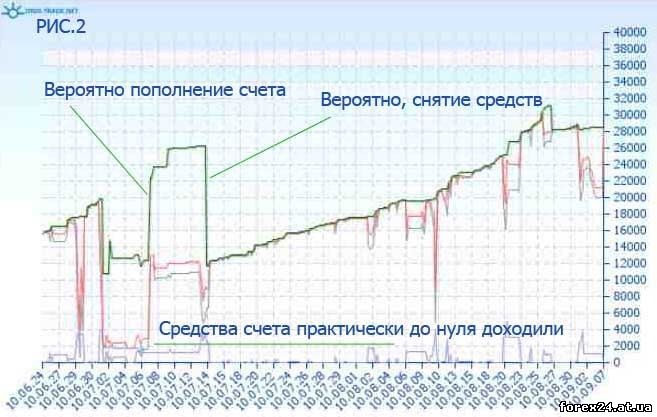
As shown in figure.1 and 2, there will be a fall of the funds in the equanimity of the balance curve. Such a picture is characteristic for the following directions of trade: the Manager does not use stops and waits, when the price will return to the profit zone at the expense of work is being done by locking unprofitable positions in trade use averaging. Any of these options should make a potential investor wary.
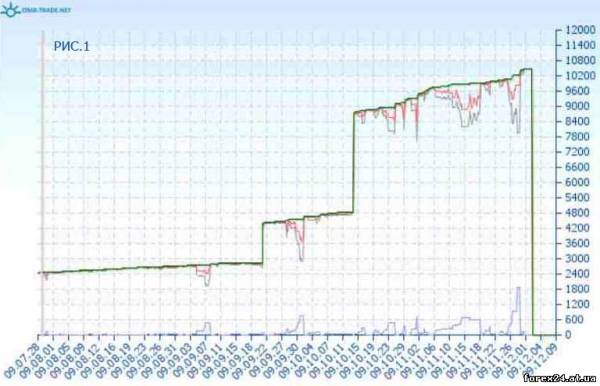
Figure 2 marked situations that are not sharp profit or loss in the account, and only deposits and withdrawals. Here we also observed that the deflection curve of funds is very serious, which several times nearly ruined the entire bill.

The amount and Deposit
In order to identify trading using averaging, you can use the same graph of volume of transactions. In Fig.3, we see that the volume of the lots that were used at one time or another day. Be alerted should the situation with a sharp increase in this amount in a single day.
It may say of course that on this day, the trader made a lot of deals, more than usual, but if the graph of the yields we see in this day a serious decrease in the curve means that more than likely will be trade with position averaging. This trade in General is quite reliable and often will result in full loss of Deposit. Therefore it is necessary to identify the use of the reception Manager in advance.
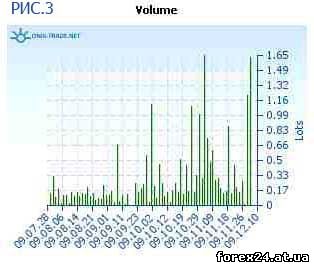
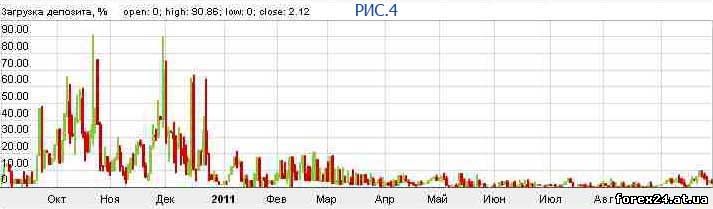
Figure 4 is a graphical depiction of utilization of the Deposit, as seen in PAMM accounts Alpari. The scale of interest helps us understand what the volume used by the trader to trade on the value of all his accounts. As we can see, in this case the trader is not weakly risk, using almost all of Deposit funds for trading, but then reduced risk. Such a chart can know how big the risk in the trade Manager uses.

The yield curve in paragraphs
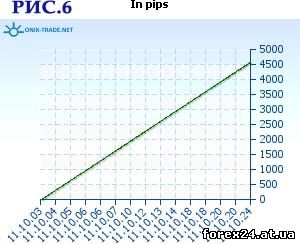
It is very important that any statistics maintained in points. If it is possible to observe graphically, this can be a useful tool for understanding the reliability of the trade. First and foremost, if the yield curve is a continuously decreasing in the negative line, but this income account grows, the most likely reason is the use in trade averaging. This is because, traders are rarely the martingale system. Averaging a losing position they start to increase the working lot deals.
This method allows in some cases to close the entire series of transactions at the same time so that the last transaction of a large volume would bring profits covering the losses on the first of a series of transactions of small volume. In this case, the Deposit obtained monetary profit, but here in points is a loss. Details about the methodology of averaging can be found in the section Shopping techniques.
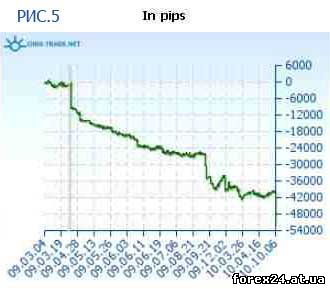
You need to consider that a curve of yield in points as well based solely on closed transactions. Consequently, if trades are in loss and the trader they do not close, the curve in the points will only grow.
Is not rare to see if the Manager uses a hedging strategy. In this case, it can keep in lokah losing trades and only close the ones that already came out in profit. Read more about locking can be found here. The yield on the chart it will look as a constant difference between the curves of the balance.
|
| Category: Forex | Added by: (30.10.2017)
|
| Views: 379
| Rating: 0.0/0 |
|