|
Statistics
Total online: 1 Guests: 1 Users: 0
|
Trade
QQE indicator for Forex. Share market conditions
There are a large number of indicators, capable in varying degrees, to share trends and flat. This is very handy when Your trading strategy is designed only for one state of the market, such as trend, and not able to make a profit when the price is moving sideways.
The QQE indicator refers to the same category of algorithms, but compares favorably with its reliability and stability, despite the market circumstances. This statement is confirmed by the fact that the QQE has been successfully used by traders even in 2008.
Qualitative Quantitative Estimation - the name chosen by the authors for the algorithm. Will not parse the name of the programme, as there is no doubt that it is true. However, the indicator was interesting and he further discussed in detail.
The QQE indicator: description
Based on what the algorithm of the indicator QQE? The authors used the relative strength index, but other than it involved smoothing method. In General, in terms of settings, "test" is quite simple, there's even a twist nothing, because the variable is only one "SF", of course, if not to take into account the color selection of the line or its thickness.
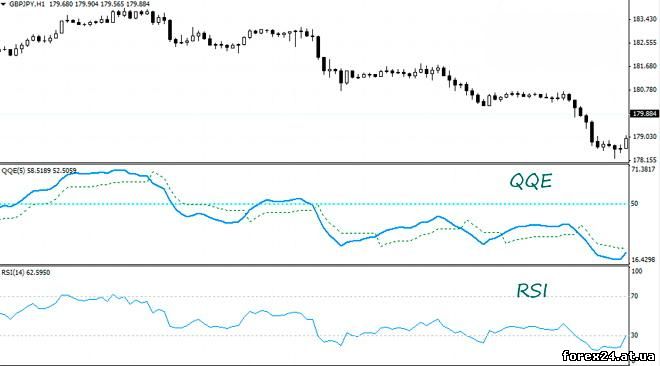
As you can see, there is nothing supernatural here, it is a curve that is very similar to the standard RSI. By the way, it is possible to compare both algorithms and see significant differences between them:
About configuring SF to even say much because she is very much like a variable in RSI. You can try to change the value and see how this influence will affect the indicator line. However, then I will consider Qualitative Quantitative Estimation without changing its settings.
The QQE indicator: application of the algorithm
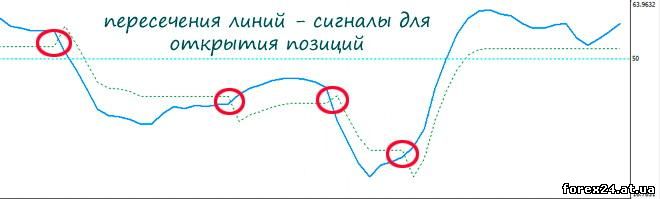
Why we may need the QQE indicator in Forex trading? The most common method of use - getting signals to open positions at the intersection of the lines (main and signal). In this regard QQE visually can resemble a MACD that some traders use is almost the same.
Quantitative Qualitative Estimation can be attributed to fast algorithms that are not characterized by serious delays. For its successful application it is better to take TF=M15 and above, which will provide a very significant profit on transactions.
The indicator lines change of values only on the current candle that hasn't closed. When the candle closes, but the value lines are fixed from the time of the latest quote for the period of the candle and do not change. How this should be reflected in the trading process? For the agreement to wait until the candle closes.
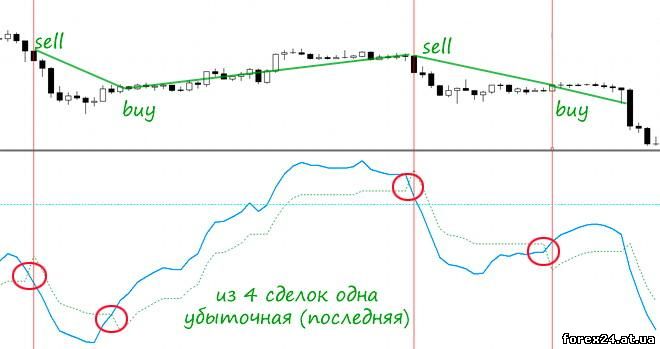
This means that you can not open a position as soon as I crossed the line and should wait until the current candle closes. Only after closing the candle you can see, there is a line intersection or not. If not to take into account the condition of the candle is closed, it is possible to make a mistake - to make a deal, and the lines will diverge (lost signal).
I recommend to pay attention to these two indicators:
• The Laguerre indicator for cyclical fluctuations
• Waves Bollinger trade from the price channel
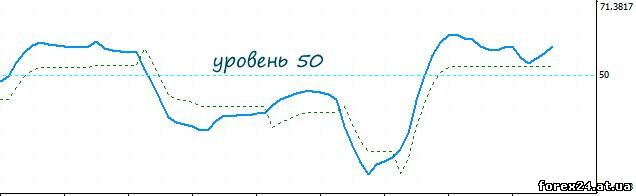
What else can help Forex QQE indicator? With this program you can quickly assess the market situation, understanding, when in global terms, the flat, and when the trend is. In this case, there is nothing difficult, consider three possible options:
1. if the indicator line is significantly above the 50 level, the trend is upward;
2. if much below 50, a downtrend.
3. if the line is fluctuating near the 50 level (just above or below), then the market is flat.
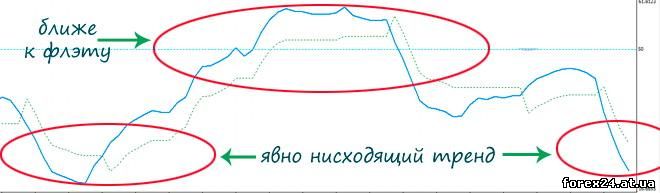
These data may need to trade when you need fast, and most importantly understand what is the current global market situation. While make deals possible, based on absolutely different principles than in the QQE, and his testimony only be used for filtration of a market condition.
As a conclusion I want to say that the indicator QQE Forex is a really useful analytical tool. Its survivability has long been proven, it is very well keeps the strike the market that was proven by the financial crisis in 2008, and the subsequent irregular volatility. At least, the algorithm definitely deserves the attention of traders.
|
| Category: Forex | Added by: (05.11.2017)
|
| Views: 976
| Rating: 0.0/0 |
|
