|
Statistics
Total online: 1 Guests: 1 Users: 0
|
Trade
The Kagi Chart indicator for Forex
As you know, Japanese traders have always distinguished themselves by their skill and ingenuity. For anybody not a secret that candlestick analysis just went from Japan, and a lot of traders around the world are actively using it to trade.
Japanese investors have created a large number of different tools that greatly facilitate the analysis of the market. Among these tools are: Renko charts, Japanese candlesticks and more.
However, the focus of this article will be a completely different tool to display the price trend is Kagi Charts. Data graphics are an effective and its non-standard, but what is this standard?
First, Kagi Charts were created to track the strongest price trends and to identify strong pulse vibrations, through which the market can dramatically shift in one direction or another. Using this tool, the trader analyzes the market may simply not take into account the time factor.
In this case, the speculator will be totally focused on price movement and find potential highs and lows of the market. After their appearance Kagi Charts represent the following:
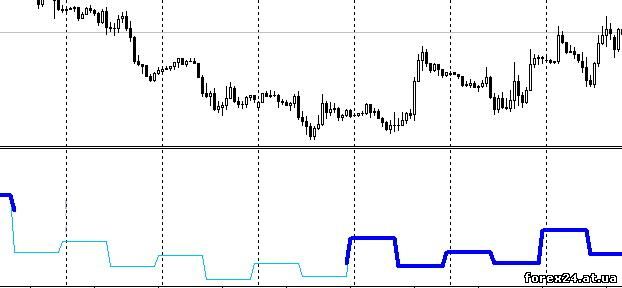
As You can see, this graph represents the vertical and horizontal lines, which, depending on the strength of price movement will change the thickness. It is noteworthy that each line on the chart has its own name (for Japan it is very common).
• IAN is a thick vertical line.
• YIN is also a vertical line, but it visually thinner.
• The SHOULDER is a horizontal line graph which connects the line of YANG and YIN.
• WAIST – is a kind of wall that connects YANG and YIN.
• Note that the formation of the line YANG shows us the growth rates, respectively, we need to consider trades in the direction of the uptrend.
If it is YIN, it is a sign of development of descending trend, and we need to consider the appropriate entries in the direction of this trend. Lines of YANG and YIN can change roles, but it can be done strictly in the formation of certain market conditions.
Here a key role plays the distance that price should go above the horizontal lines to the YIN and YANG have changed their roles. What should be this distance? Here the question to answer accurately is impossible, for the stock market, the optimal deviation value of a stock is a barrier in 5% with regard to Forex, the most appropriate will be a deviation of 0.4-1%.
How to use Kagi Charts in practice?
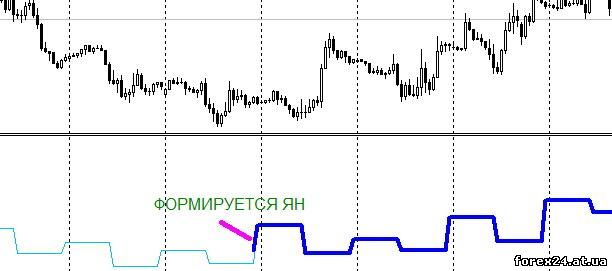
First I would like to note that the use of data charts directly in the market is not so easy. However, there are a number of recommendations that will allow to identify changes in market dynamics, using Kagi charts. Open buy we have the formation of the line YANG, and sales we begin with the forming of the line YIN. Let's look at some examples:
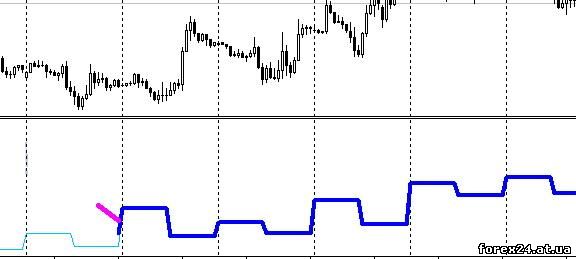
The example clearly shows that the formation of the line of YAN, as she became fatter (is vertical. At this point we can access the purchase market, as a result, the price has really gone in the upward direction, and an order would be profitable.
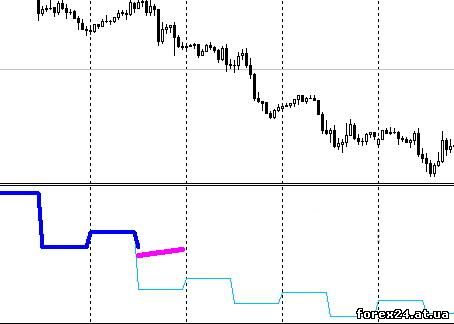
In this case, we see that YANG gradually transformed into YIN as the line became thinner. Thus, you can immediately open sale, in the end, the price steadily moved in a downward direction, and the deal would be profitable.
In addition, if You see that row there is a large amount of the SHOULDERS and THALLIUM, it is a direct sign of imminent trend reversal. To understand these names, look at the screenshot below:
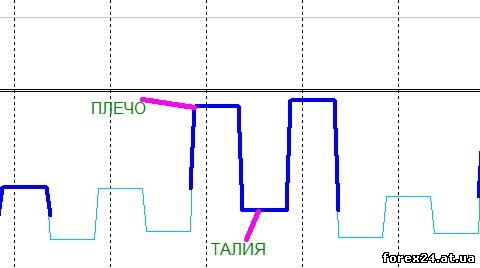
If You see the order of 10 (thick) SHOULDERS and THALLIUM, the price trend already or strongly overbought or oversold (depending on the direction of the market). In this case, You get a good chance to catch a reversal early and enter the market at the best price.
Still it is possible through the use Kagi to monitor the levels of support and resistance, but there is one point. The bottom line is that the levels are formed by SHOULDERS and WAISTS, not always well-behaved work out, so you need to be extremely careful.
As with any technical analysis tool, Kagi Charts have their conceptual advantages and disadvantages. The advantages we can include the fact that this tool will allow you to focus on the most price movement. In this case we don't care when there was a closing or opening of the candle.
In this sense, Kagi is very similar to Renko where is just as important as the price has moved in one direction or another. In addition, this tool with great success you can apply in different markets and underlying assets, the main thing – to choose the most optimal settings.
Of the shortcomings can be noted that Kagi Charts are difficult to apply for beginners as there are a large number of terminology. In addition, this tool is significantly lagging behind the price, which is in the development phase of consolidation in the market may lead to serious losses.
In this article, we reviewed what Kagi Charts and how to apply them in practice. From the foregoing it can be concluded that Kagi is a promising tool of technical analysis. In fairness it should be noted that methods of discarding the factor time was not very popular. However, experts in this field that could make Kagi a part of his trading system are due to such techniques a good profit.
|
| Category: Forex | Added by: (05.11.2017)
|
| Views: 464
| Rating: 0.0/0 |
|
