|
Statistics
Total online: 1 Guests: 1 Users: 0
|
Trade
The Power indicator Fuse description and method of use
The Power Fuse indicator belongs to the group of so-called hybrid methods, which combine several well-known algorithms. According to the authors, this approach should eliminate the shortcomings of the old formulas and to provide a competitive advantage in the modern market.
In General, why began to appear "hybrids" on Forex? The answer is simple – for the same reason that some former traders who start off exposing the rollers on the financial markets in a negative way, they say,brokers prevent making, market makers specifically racking system (the result of the natural evolution of the market).
Today, when there is a history of my observations, I can confidently say the financial market is constantly changing, and "puppeteers" are not related to system failures.
Judge for yourself, in the first half of the 20th century was a popular classic technical analysis, and then changing it prisondoor, through which people made millions. With the advent of computers rapidly began to gain popularity in the analysis of the volume, but after some 10-15 years the Internet has fundamentally changed many processes, with the result that I had to look for new directions of analysis, as appeared the Price Action method.
But the market continues to evolve, so did the idea to breathe new life into old methods and the first thing that came to mind of the developers – just to combine the indicators.
The Power indicator Fuse: parameters and principle of operation
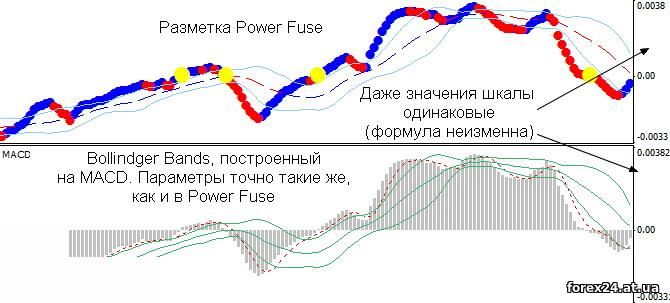
The algorithm of the expert Advisor combines the MACD and Bollinger band, in fact, the first chart is built the standard MACD, and then based on its value calculated on the Bollinger bands. That's the whole secret, and as a bonus, the developers have assigned different colors to the key points and signals. The following graph shows an example of the markup Power Fuse:
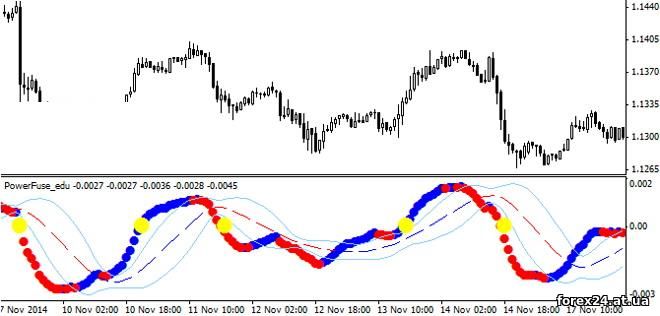
The sequence of the groups – a good old MACD, but now the downward trend represented by red circles, and the rising blue, the point of intersection of the zero level has a yellow color.
The envelope of the three lines was slightly delayed relative to the Moving Average Convergence/Divergence, is nothing but a standard Bollinger, based not on market prices, and the value of the main indicator.
As for settings Power Fuse, then there is almost nothing to comment on, as they are the same settings used in the algorithms, but in order not to confuse beginners, it is better to list the parameters:
• BandPeriod – calculation period for the construction of the Bollinger bands;
• Fast – a period of rapid "mA";
• Slow – a period of slow "mA";
• Smooth – smoothing moving average (signal line);
• StdDev – the number of standard deviations to construct the borders of the envelope.
The following graph presents an example of constructing a standard Bollindger Bands on the MACD with using "Previous indicator's data".
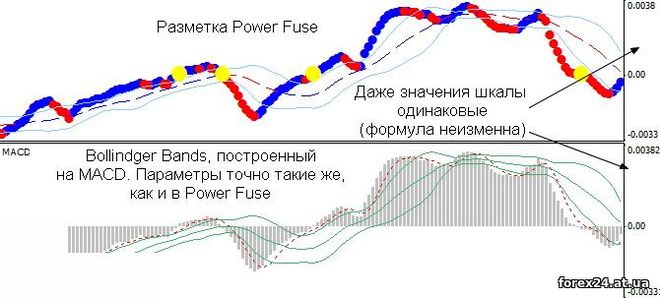
Very similar to the Power Fuse, isn't it? Actually, the way it is, simply, the histogram is poorly perceived visually, but with circles it is easier to work.
Signals Power Fuse
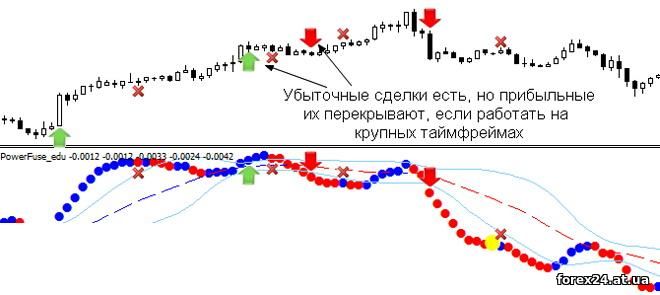
The first group of signals is focused on finding emerging trends. It is necessary to wait for Power to Fuse a sequence of circles was consolidated within the channel, after which the author recommends to make a bet on growth or decline of the pair depending on which boundary of the channel is broken after consolidation.

The profit is fixed once the mugs change color to the opposite.
See else these two indicators:
• X-Lines
Indicator ZZ
As strengths inherent in such tactics, we can distinguish the following nuances:
• A relatively small time lag.
• Standard deviation (taken as the basis of an indicator Bollinger) filters out most false signals.
• Trending method works on any instrument that is a universal.
• Codes of the indicators were not modified, and therefore the Power Fuse is not just fitting under the history, and the objective method.
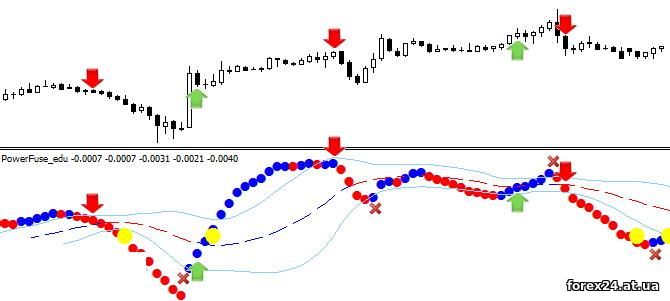
The second set of signals is kind of the antithesis of the just discussed algorithm, in this case the position is opened after the return of the sequence of circles in a range of BB:

Profitable operation is recommended to keep as long as the mug does not change color:
1. When you purchase waiting for the red circle;
2. When selling, waiting for the blue circle.
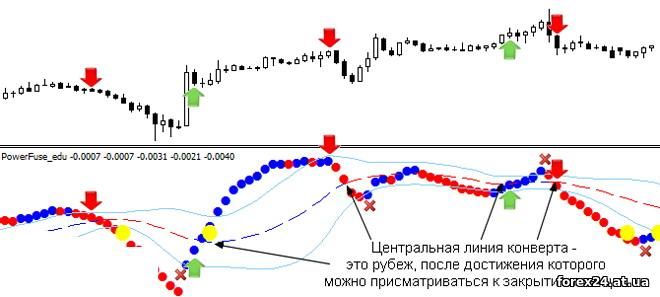
To avoid unnecessary losses to close a position you can wait to the main Power line Fuse (circles) touched on the Central line of the envelope. As soon as it happened, come into force the rules listed by the paragraph above.

This is due to the fact that the value of the Central line Bollinger shows the equilibrium state is a natural process that is confirmed by the statistics. But once equilibrium is reached, further events may develop in two directions:
• or former strength after the break will make a new attempt to continue the old trend;
• or the counter-force will take over.
This topic is beyond the scope of the review, dedicated Power Fuse so I recommend you to study the indicators якStandard Deviation and Bollinger Bands. If you carefully read the relevant articles, we reviewed today the indicator will appear in a new light.
|
| Category: Forex | Added by: (06.11.2017)
|
| Views: 1467
| Rating: 0.0/0 |
|