|
Statistics
Total online: 1 Guests: 1 Users: 0
|
Trade
Trend analysis is an important knowledge a trader in the trend analysis
As you know, financial markets can be in one of two States of flat or trend. The study of the characteristics of each of the provisions of the market should be considered an indispensable item in the preparation for trading. Today, we'll focus on the trend analysis, pre-understanding of how it is possible to identify on a price chart.
Trend analysis lies at the basis of technical analysis, so first a few words about "big brother". All technical analysis is based on the assertion that everything comes with a price cyclically.
It is therefore proposed to study the history of the market price behavior, to be able to predict the future.
Another statement looks like - the price discounts everything. It is implied that all the factors that could affect the prices were taken into account by the market. Looking at the history chart we can see a number of values that were formed in his time, considering different factors like news, sentiment and so on.
We now consider how graphically looks the trend movement in the picture below.
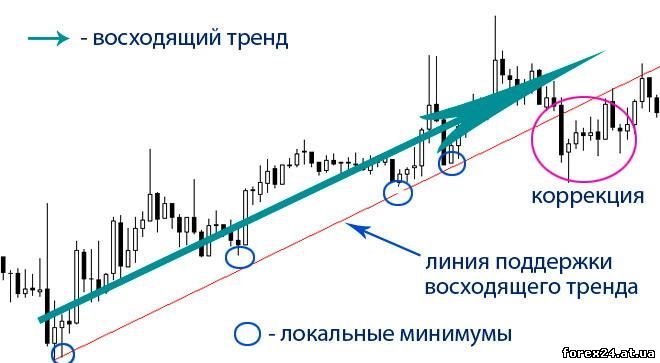
The trend is a directional movement of the market price that is different from the lateral displacement. Traders say that if the market has no trend, then there is flat. It is possible to evaluate the graph visually, as do experienced speculators, but we will discuss in detail the question of how to determine the market condition?
There are ascending and descending trend. The picture above is an example of an uptrend, and its correction. The price broke the support level and stayed below it.
It is seen that local minima are consistently increasing, which confirms the assumption about an ascending trend. In other words, the value of each of the following at least more than the previous, which together with the growing local peaks shows the growth of the market.
The correction can be considered a break of the support level that is not outgrown in full-fledged trend reversal. How to distinguish a temporary correction from a reversal of the entire market trends?
Please note that for those trend strategy:
• Trade on price pullbacks
• Work the trend with EMA
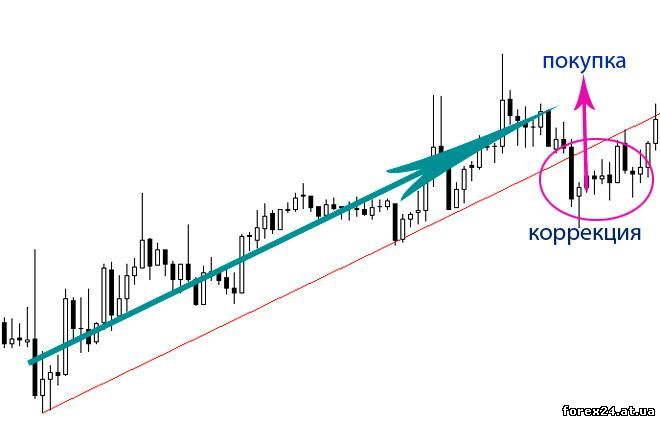
Correction in Forex trading is a convenient moment for entering into a new agreement at the best price in the direction of the trend. The figure below shows that it would be possible to take advantage of the situation, analyze the trend and enter the trade purchase.
Most trading strategies involves transactions in the direction of the trend with the following reasons:
• more than likely that trend will continue
• while the trend is not stopped, it should be used
• in the event of a change of trend will be quick to notice and to withdraw from the deal
For these reasons, the correction as shown in the picture above, looks attractive for transactions on the purchase. Note that the market remains upward trend, and the price breaking below support, has been very favorable for new acquisitions.
Trend analysis - build trend lines
Now for example let's see how to construct a trend line, we will conduct trend analysis of the situation. It must be remembered that any model, shape and build this kind of patterns, i.e. patterns that have been observed previously. Traders notice a similar situation, and then check whether it is possible from them to benefit.
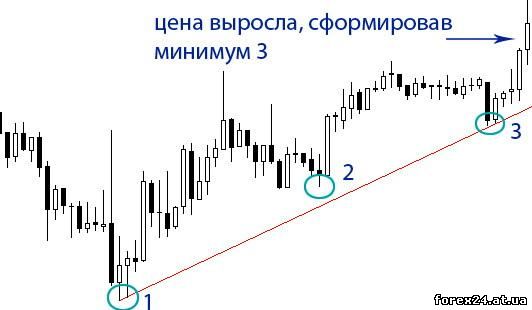
So you can get an idea about the trend lines that allows to find the directional price movements, as well as pivot points. There are such lines through the local maxima and minima. To build you must have at least two points, but more than that, it is possible to speak of a pronounced market trends.
Points 1 and 2 hold a straight line which we have now plays the role of trendline support:
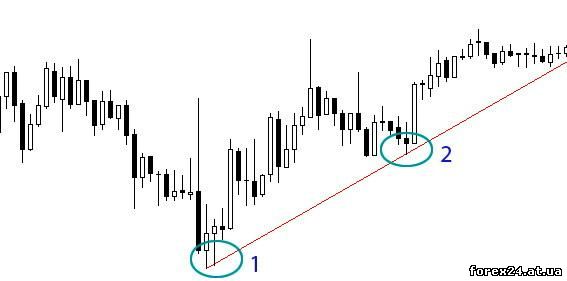
After a while it becomes clear that the price breaks the line drawn earlier. Analyzing the trend, we have revised the location of the line. When price restores growth, thereby forming a new local minimum, re-analyze the situation.
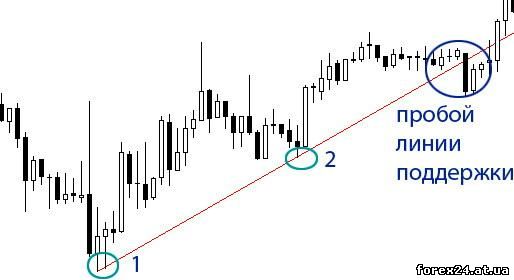
It is important that when you build a trend line attended the last local minimum and the first, which was taken in the beginning. Now we have to chart a new support formed at the expense of points 1 and 3:
So it is possible to repeatedly change, but the trend will not change. Temporary price adjustment can be used as entry points. Fans averaging strategy also used in a similar situation, which would increase the total volume of positions.
The upward trend means that the demand for trading tool continues to exceed supply, despite the ever-increasing cost. Accordingly, the downward trend reflects the reduced market demand and strong desire of sellers to get rid of the tool even declining prices.
For a downtrend the resistance line is constructed in a similar way that support for the uprising. Come from local maxima, using them is resistance, which can evolve as market development.
It must be remembered that the trend is stronger, the longer it lasts. At the same time, there is no infinitely long directional movements of the price, and that means that sooner or later we will see a reversal of the trend.
Trend analysis with the aim of finding its reversal
To trade against the trend is especially dangerous, because a trader would enter into a transaction to meet current market trends. Typically, the error lies in the fact that speculators confuse temporary price retracement with a full turn. In this case, the trade can be opened at the break through the support line of the example of an uptrend, but it is likely that the trend will not be violated.
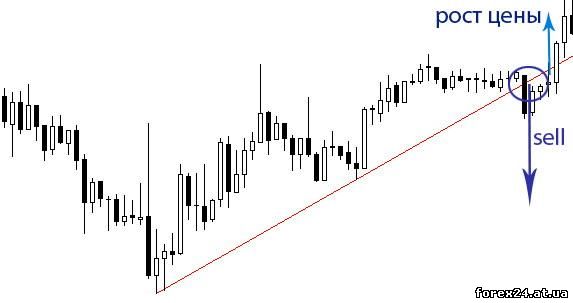
Having signed a deal to sell if the price to overcome the support line, the trader will soon notice that the downward movement does not occur. The market resumes its movement in the direction of the trend.
In order to conclude transactions on sale, you should first make sure that the price of the trading instrument really turns. As confirmation could serve as a break of the level established the previous local minimum. Overcoming the price level, as well as strengthening of market prices under it, would be a proof of violation of the upward price movement.
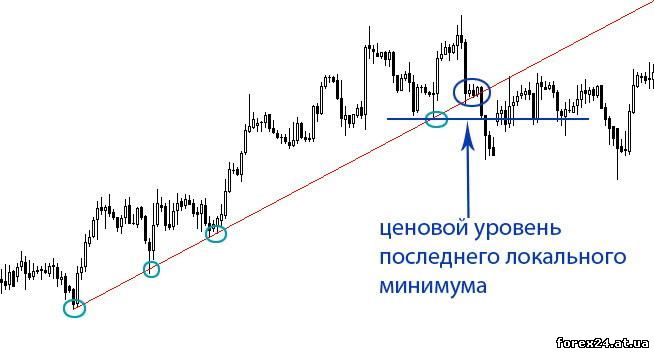
The picture shows that the market breaks the trendline, then the price goes below the level formed by the last local minimum. This situation indicates a possible termination of an upward trend that happening in the future.
Although the price is not too hard falls down, but does not reach those market values that were recorded previously. Trend analysis will help you understand when to stop to enter into transactions for the purchase, if we talk about this case. The trader should stop the trade and continue to monitor what is happening in the market, may soon be formed again, but the downtrend.
The study of the trend analysis includes not only graphics, but also forces you to develop logical thinking. Understanding the direction of the price movement allows you to make informed decisions when trading on Forex.
|
| Category: Forex | Added by: (05.11.2017)
|
| Views: 289
| Rating: 0.0/0 |
|
